RiverTools Image Gallery
Interactive Window Tools
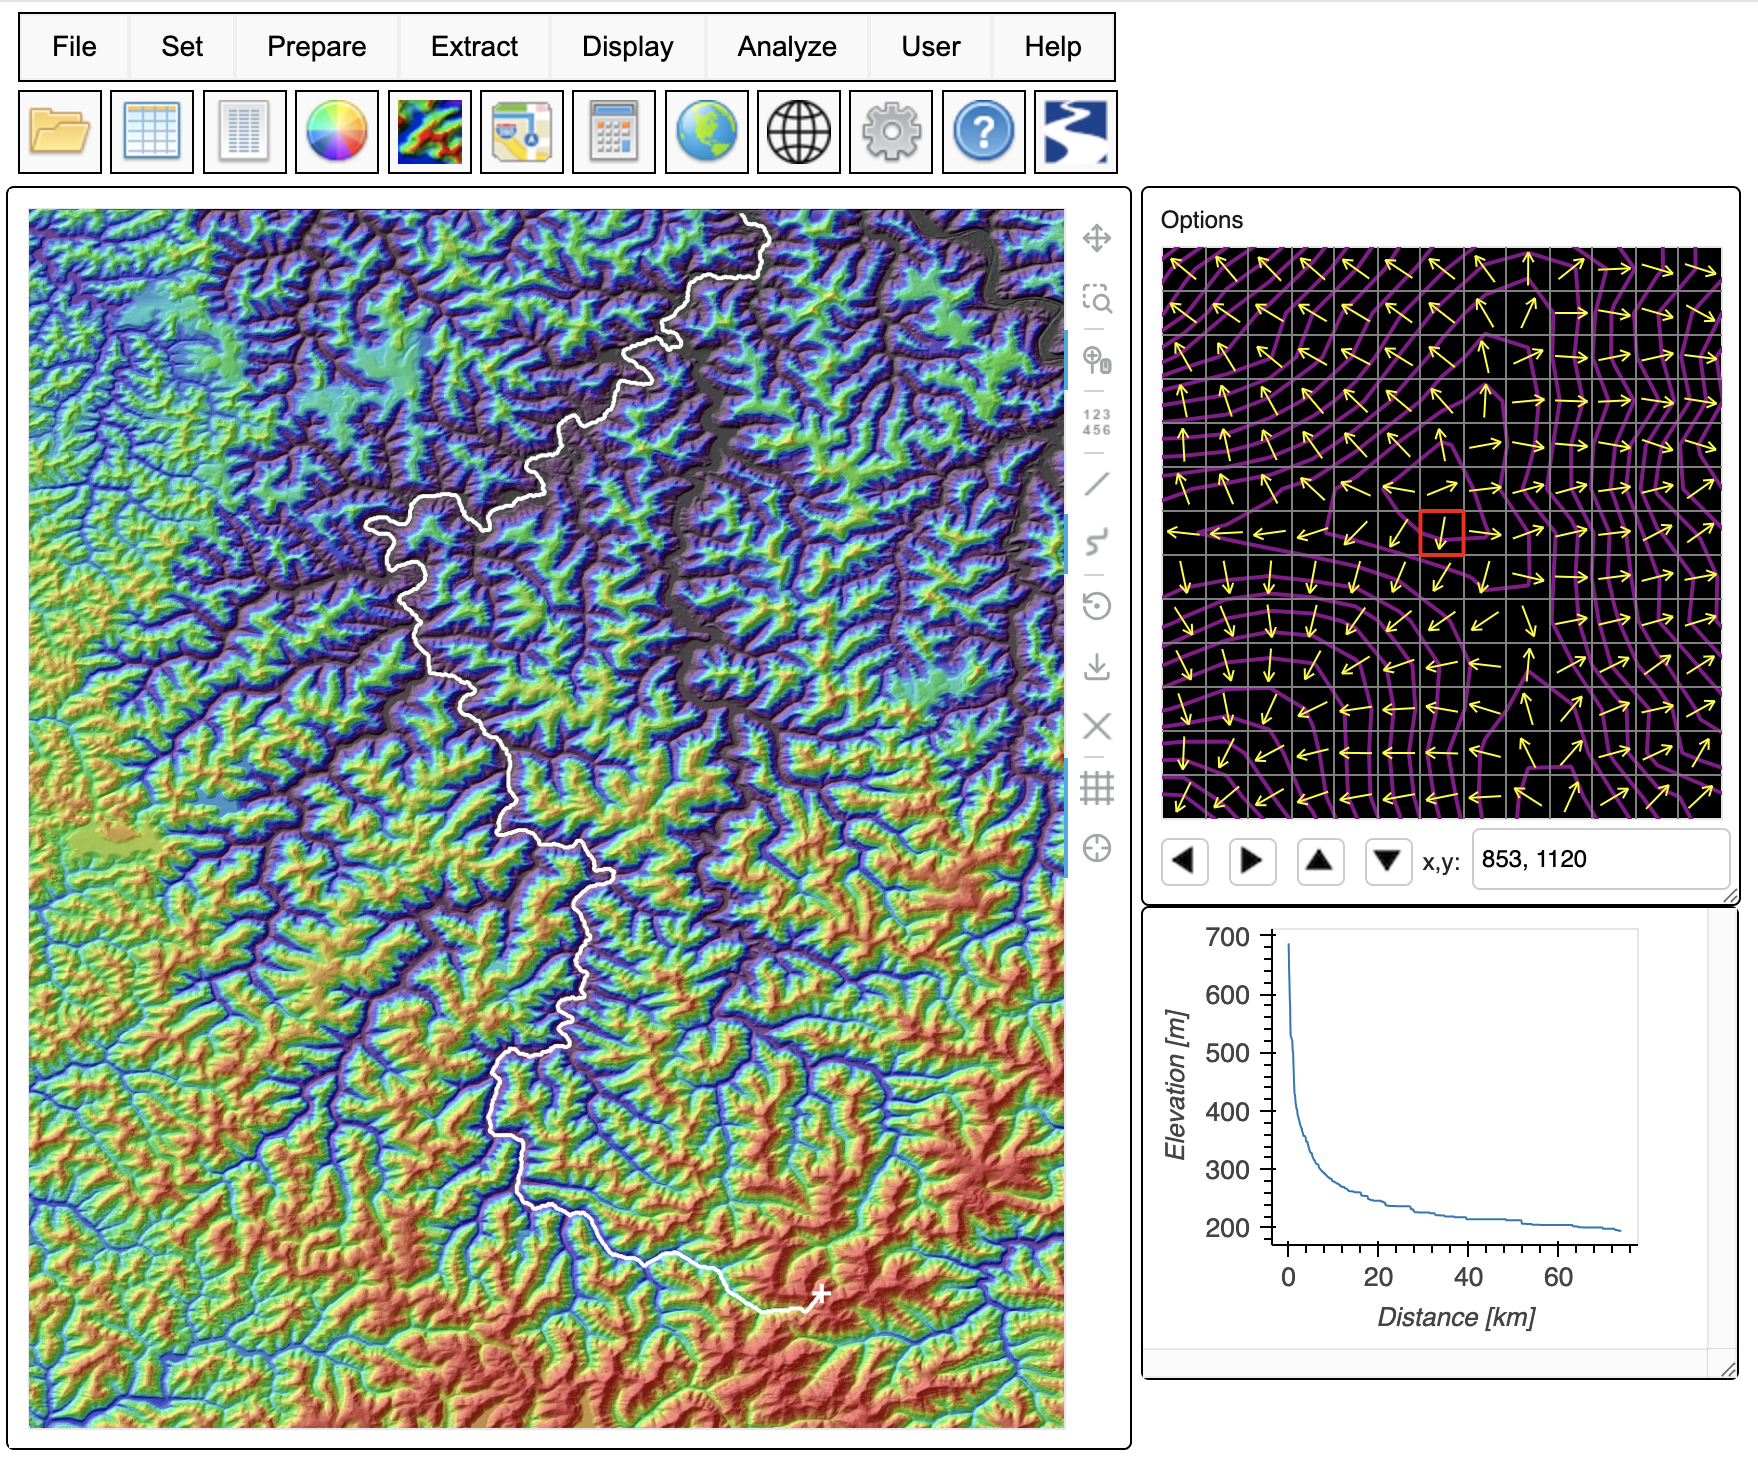
Linked Channel Profile and Vector Zoom tools, with
longitudinal elevation profile for selected streamline and flow directions.
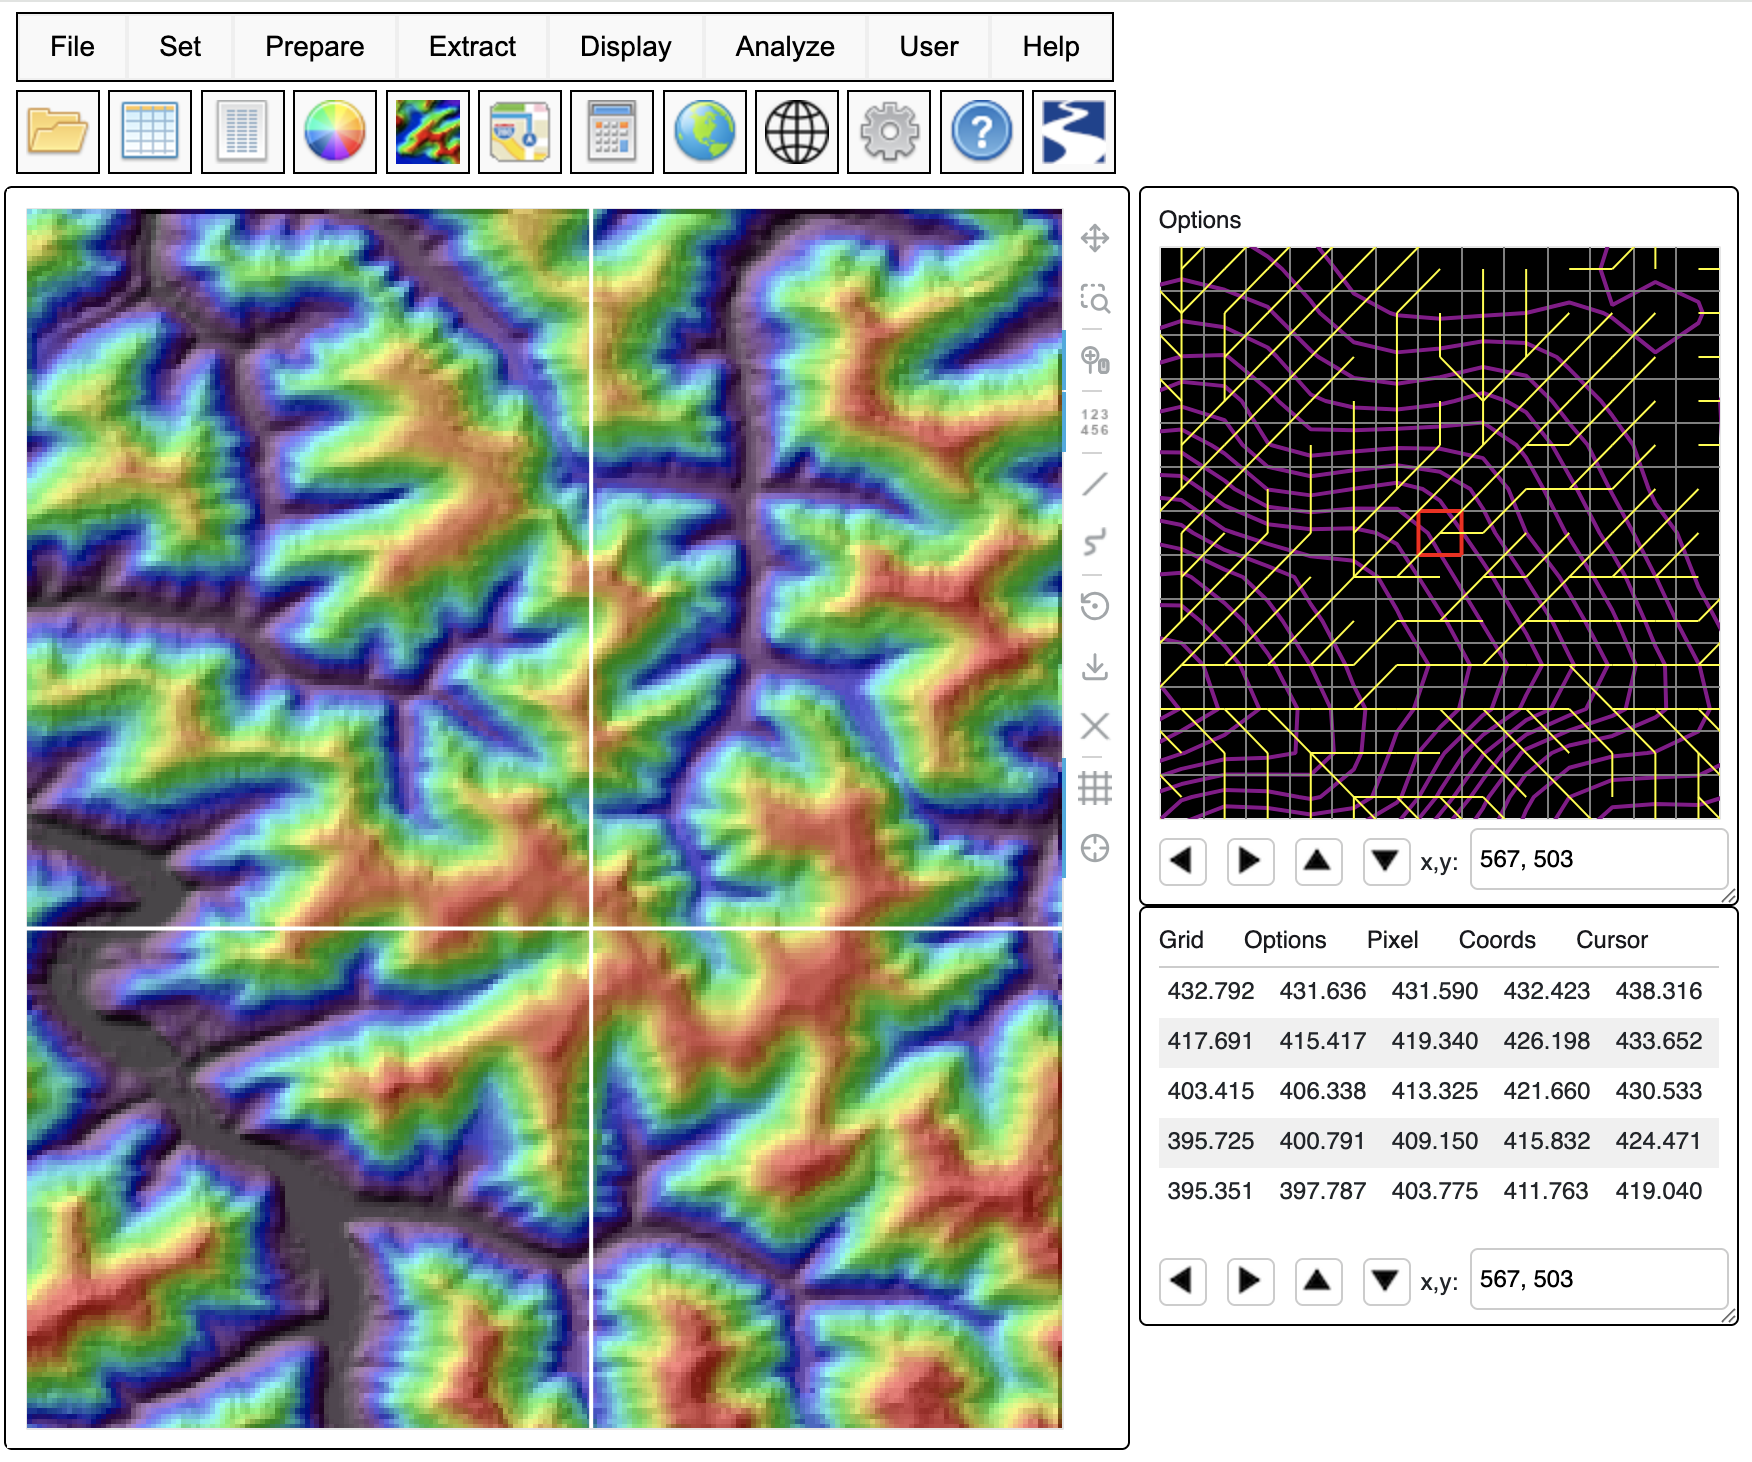
Zoomed-in view of shaded relief with linked Value and
Vector Zoom tools, showing flow directions, elevations and coordinates.
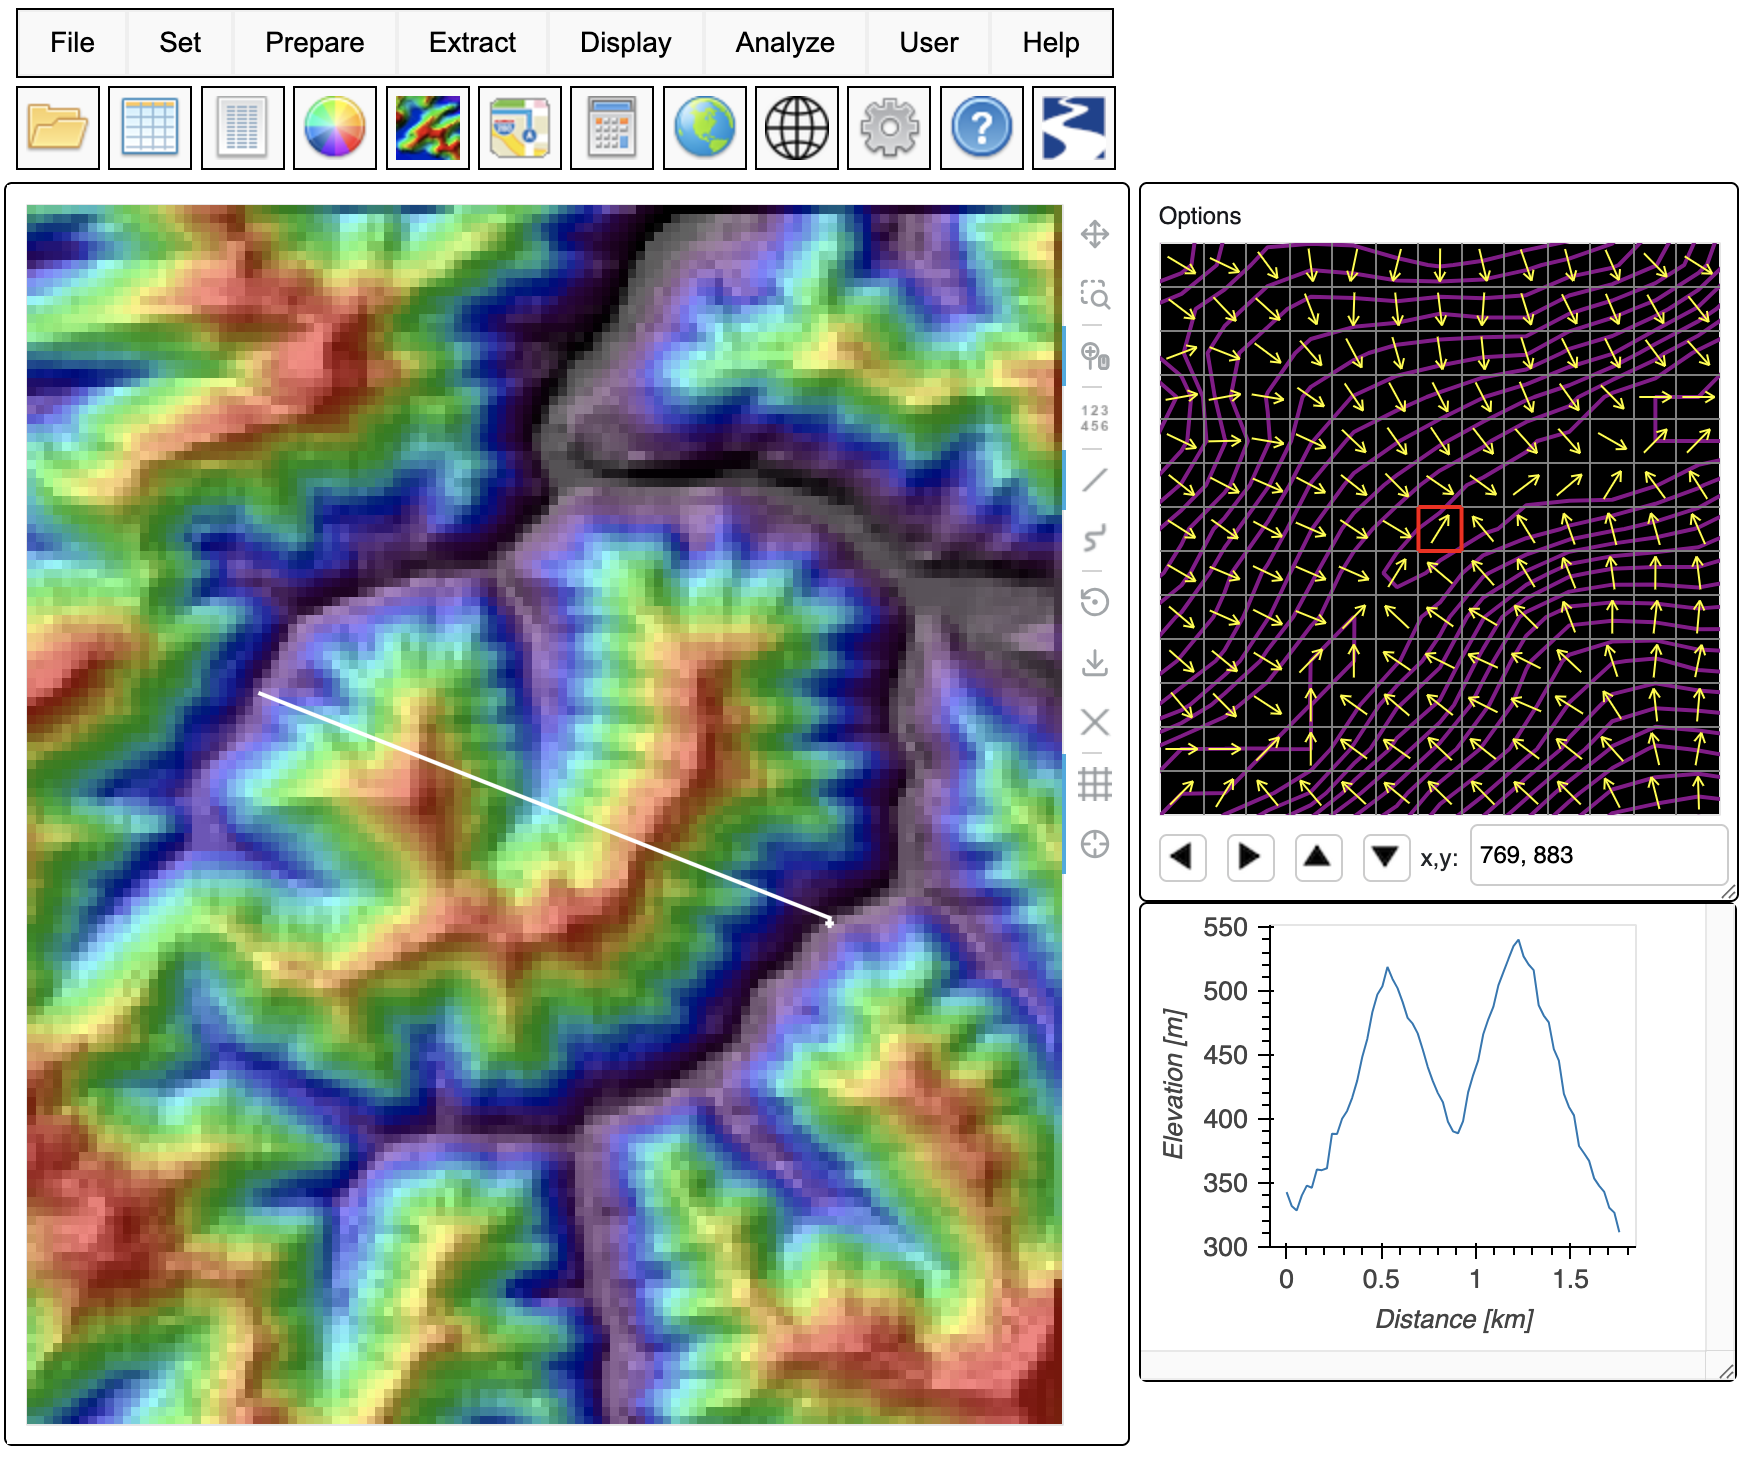
Zoomed-in view of shaded relief with linked Line
Profile and Vector Zoom tools, showing elevations along a transect.
Beaver Creek, Kentucky (Geographic)
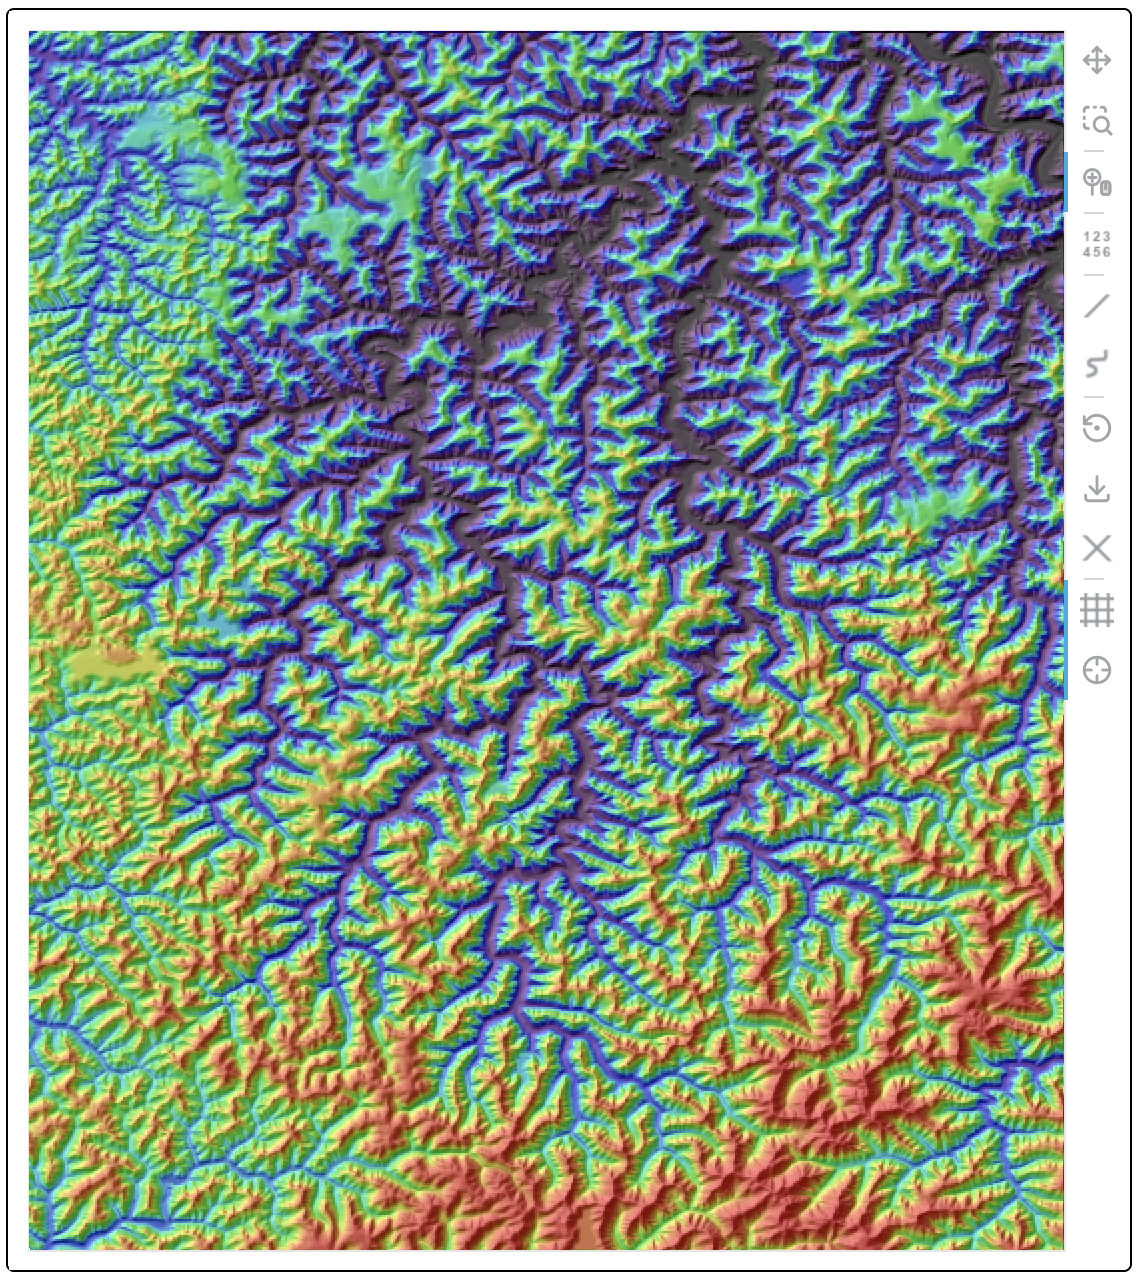
Shaded relief of elevation, with Rainbow color table.
Density plot of elevation, with Stern color table.
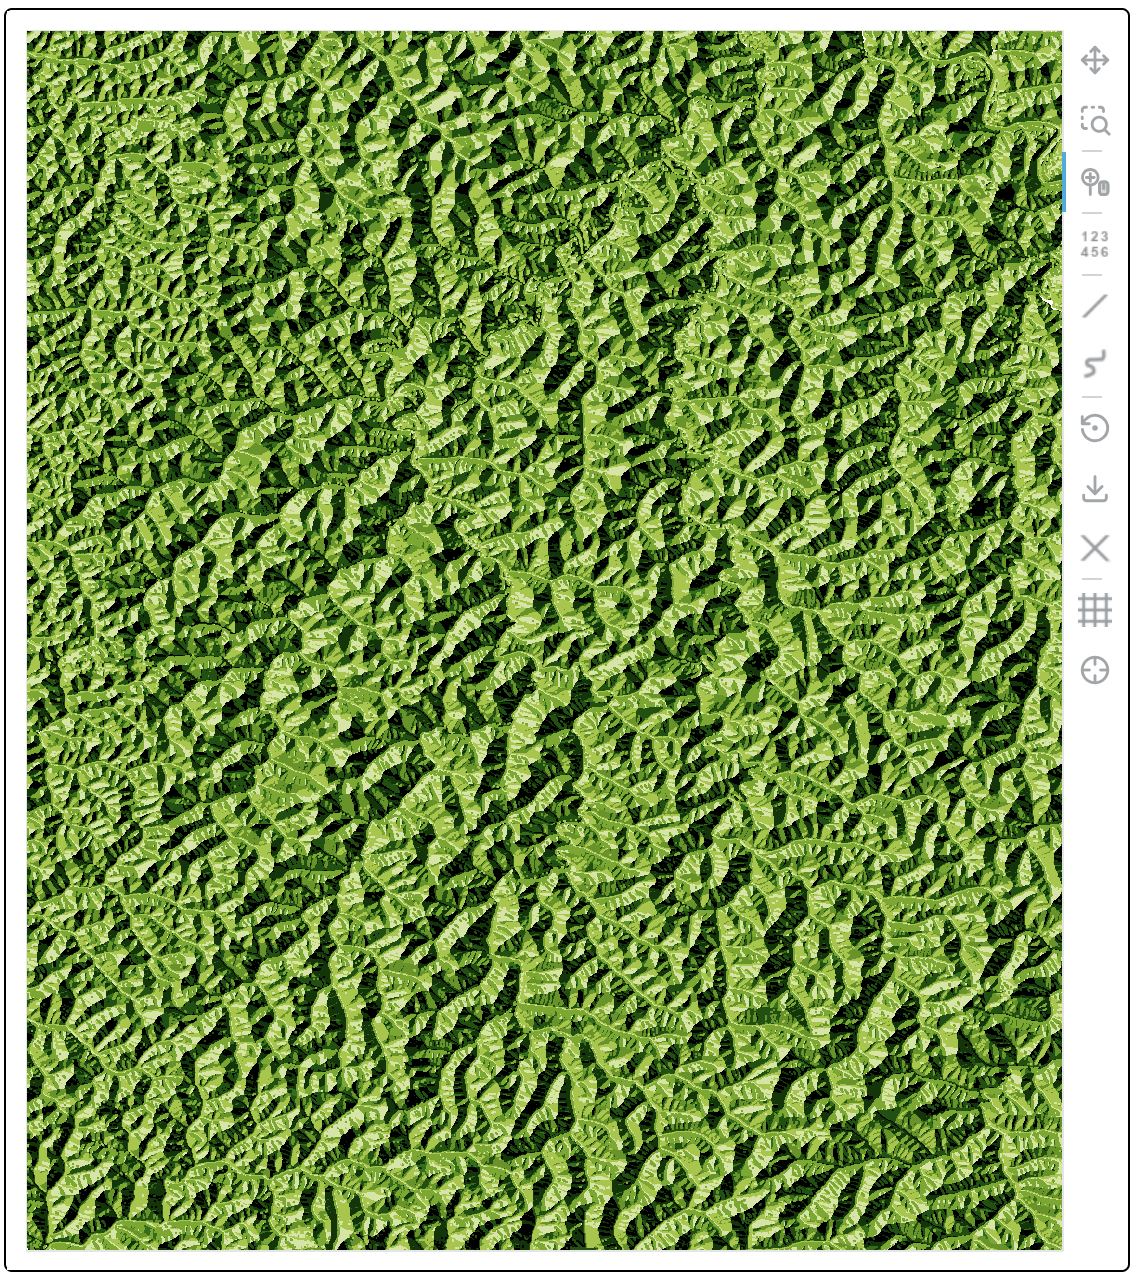
Shaded aspect, with greens, showing landscape texture.
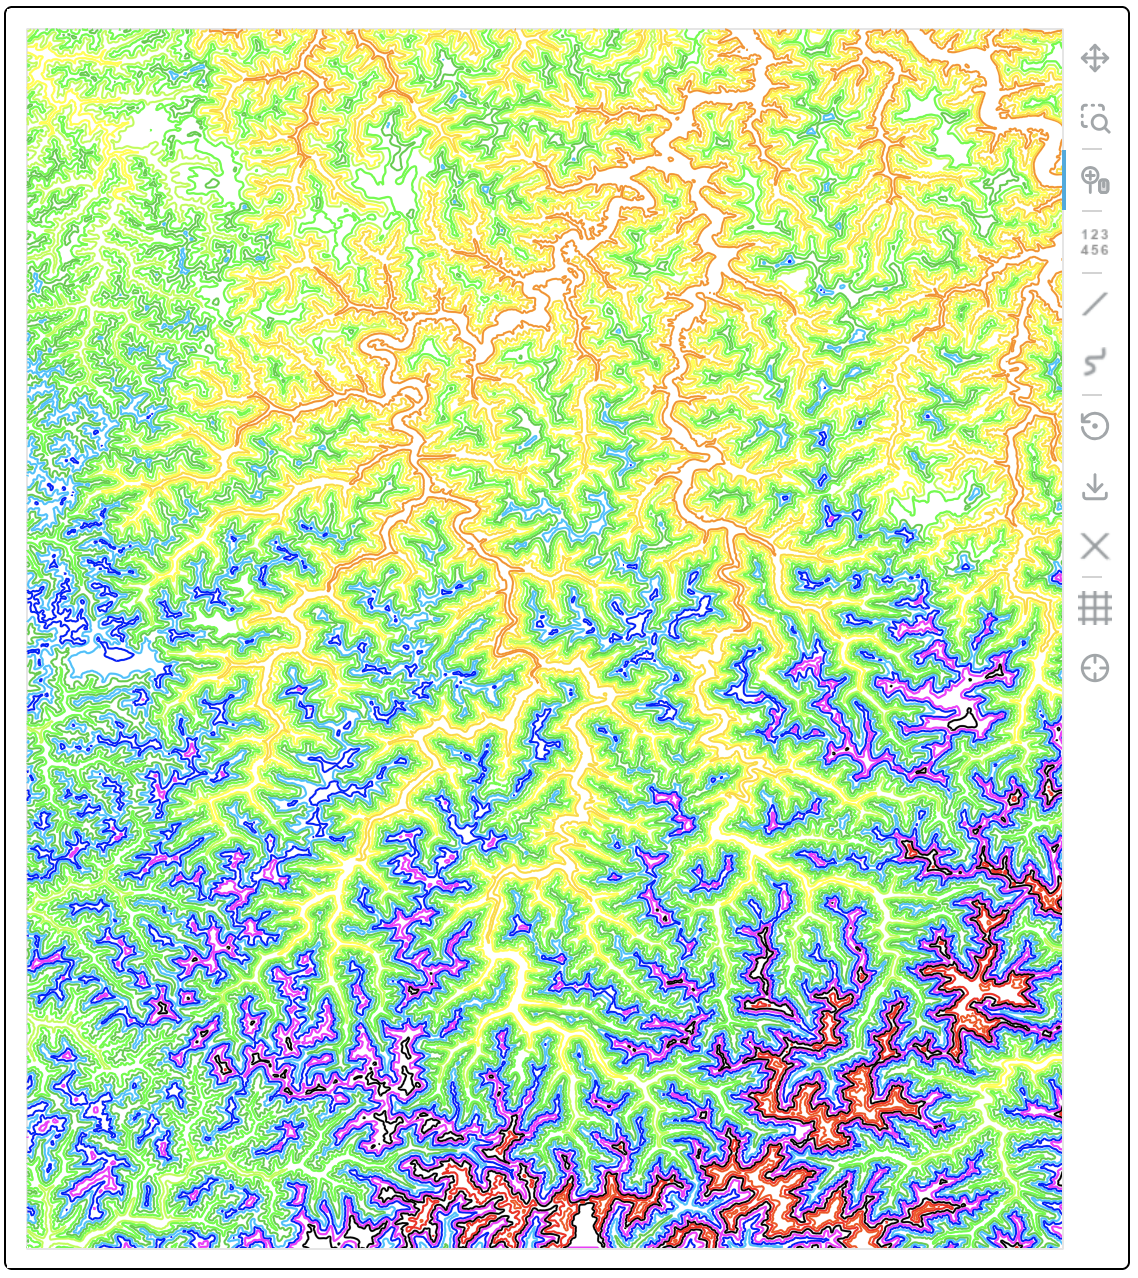
Contour plot, with line colors from rainbow palette.
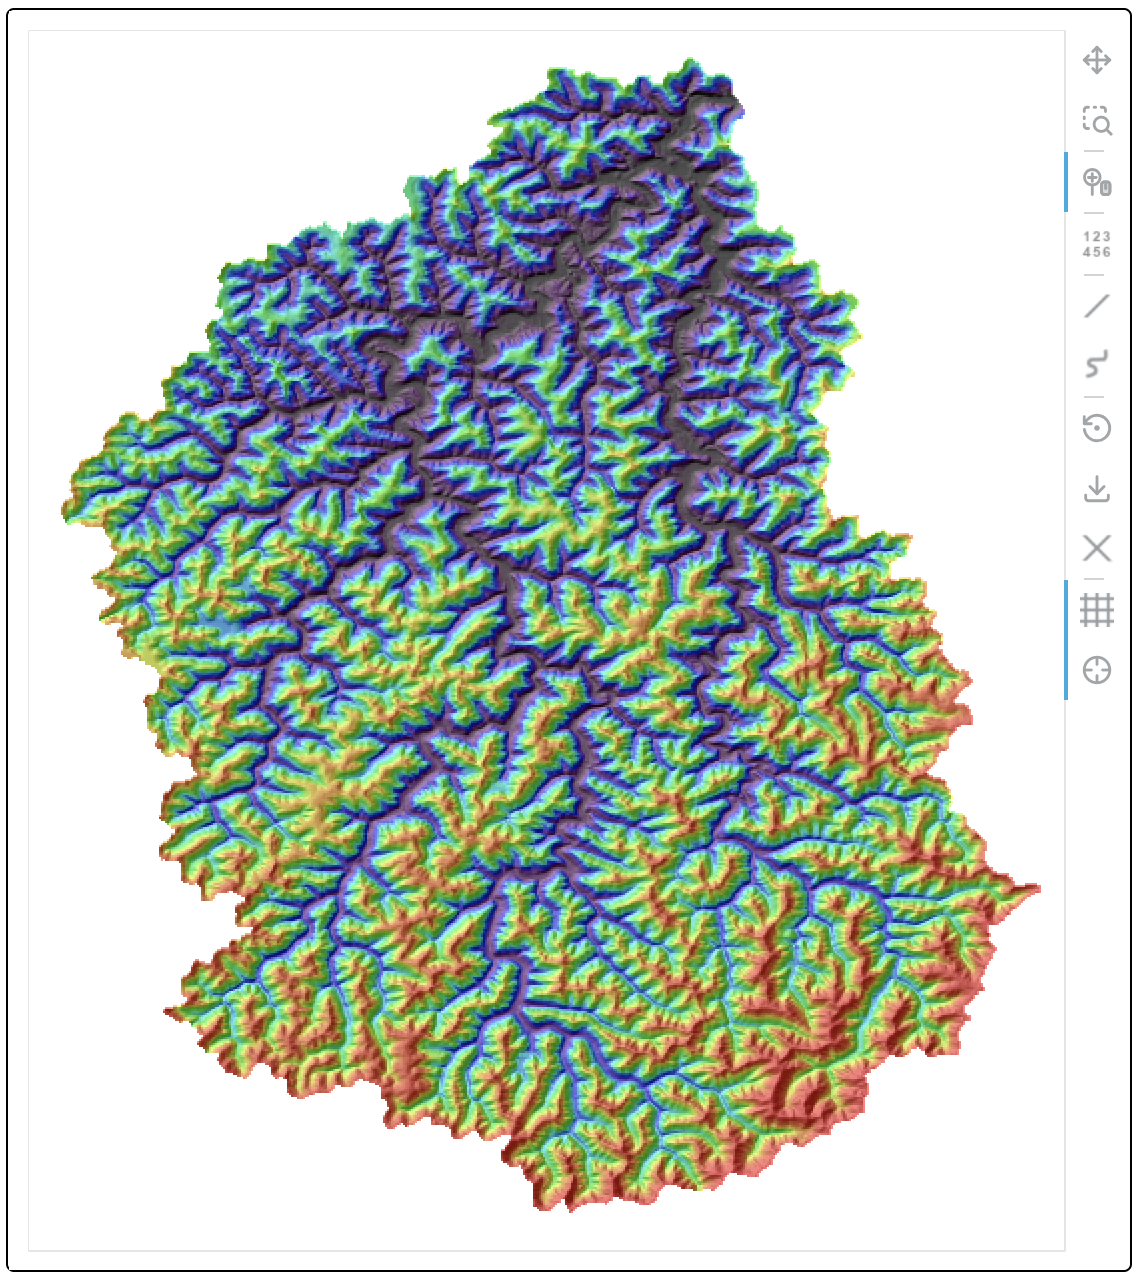
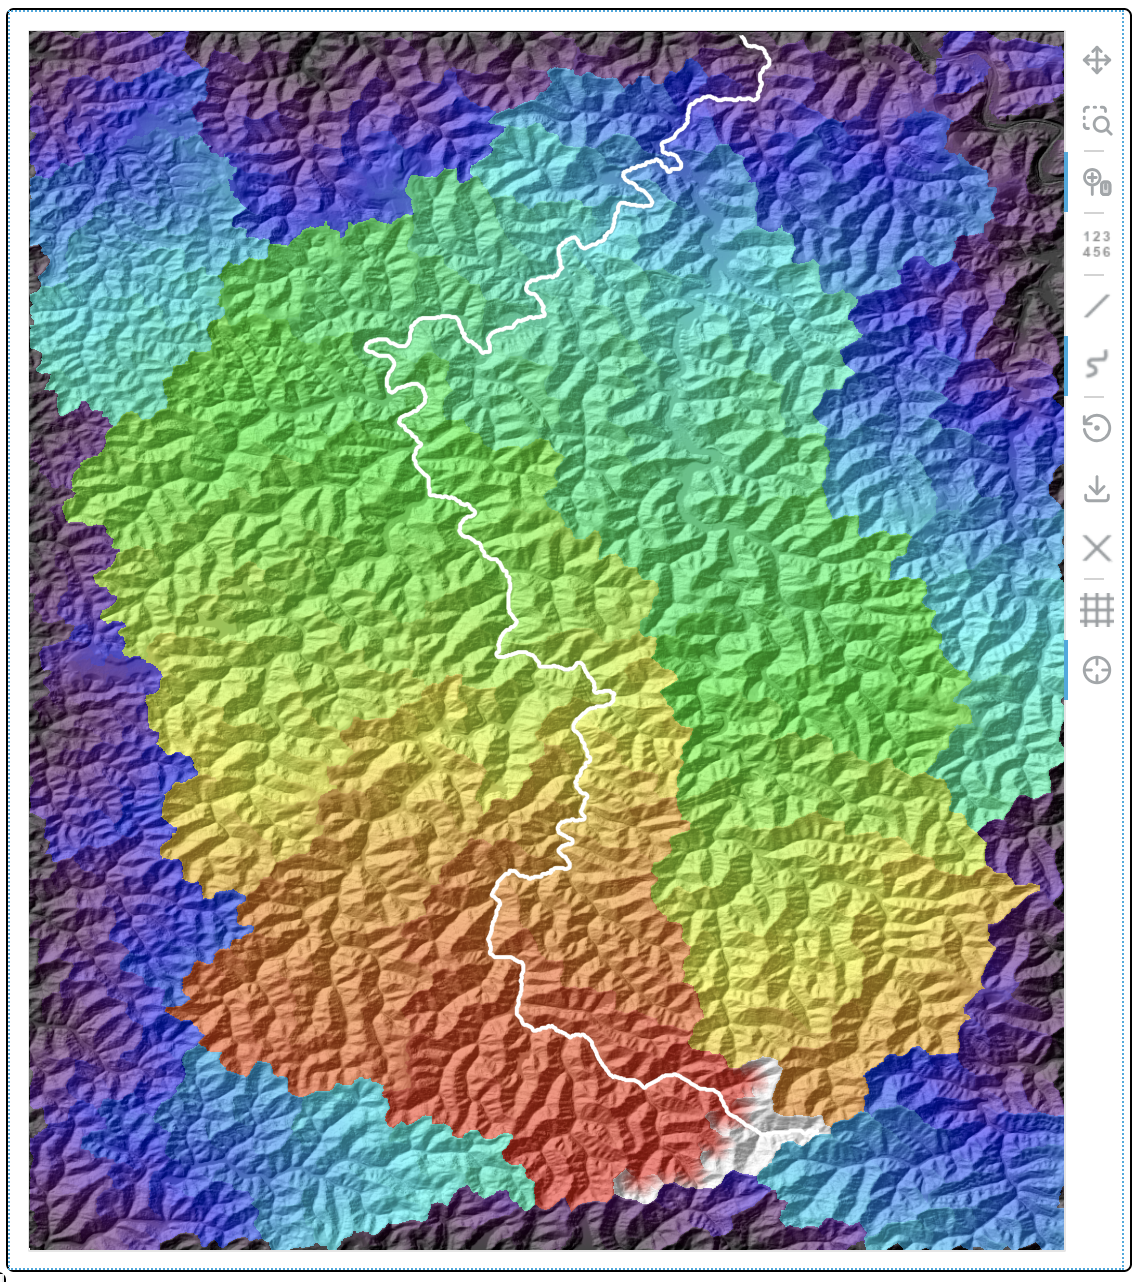
Shaded relief of elevation in main basin, with
Rainbow color table.
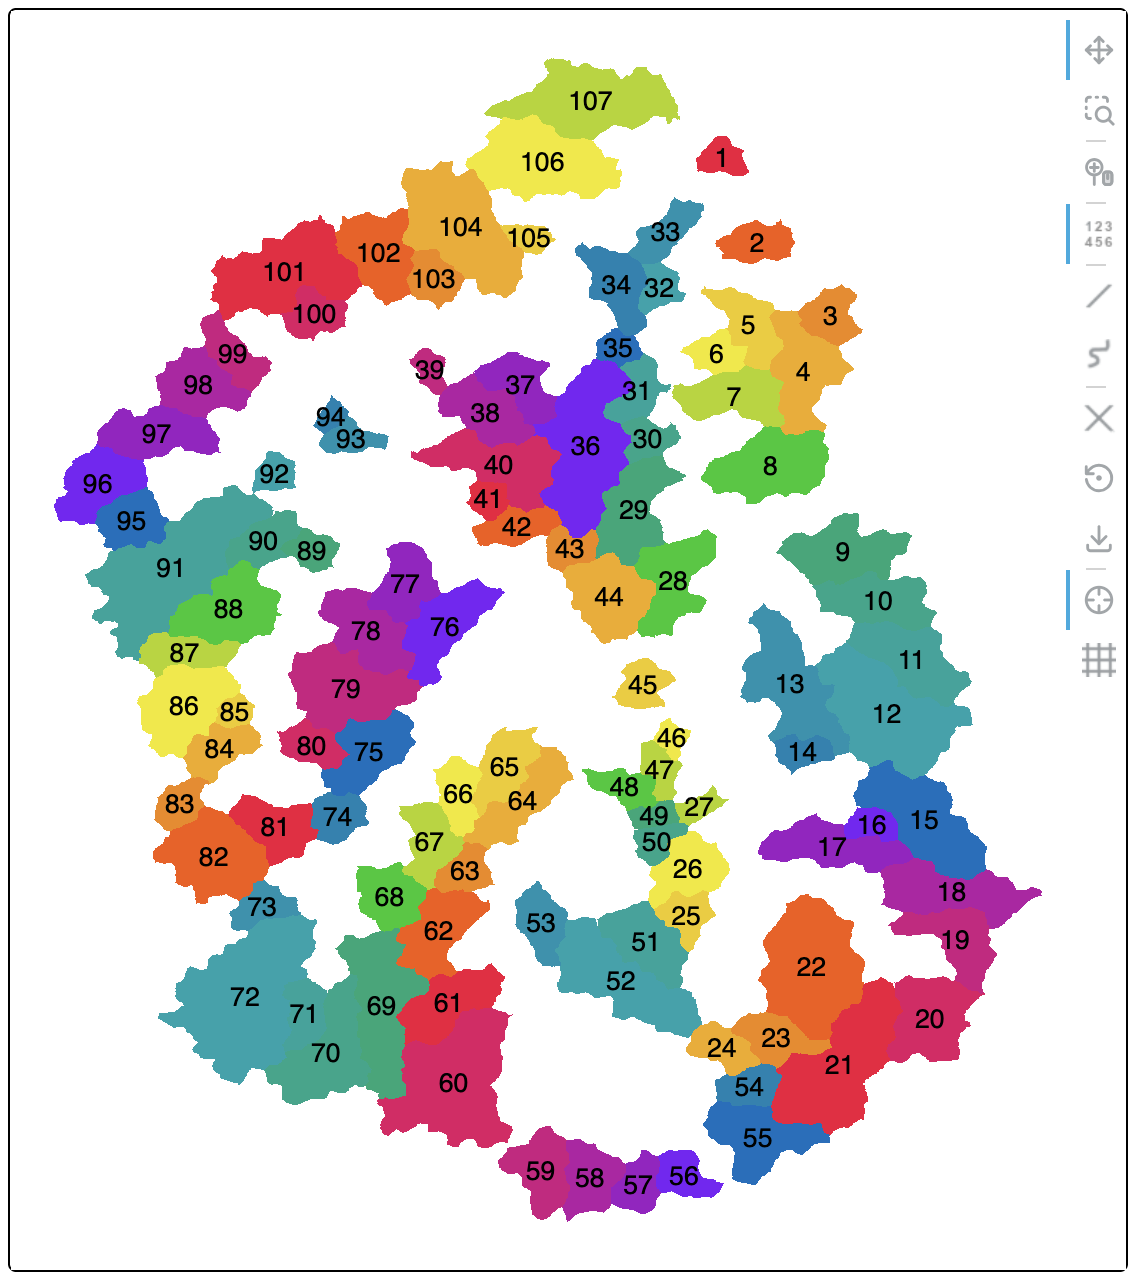
Mask of order 4 subbasin interiors, with Munsell colors
and labels.
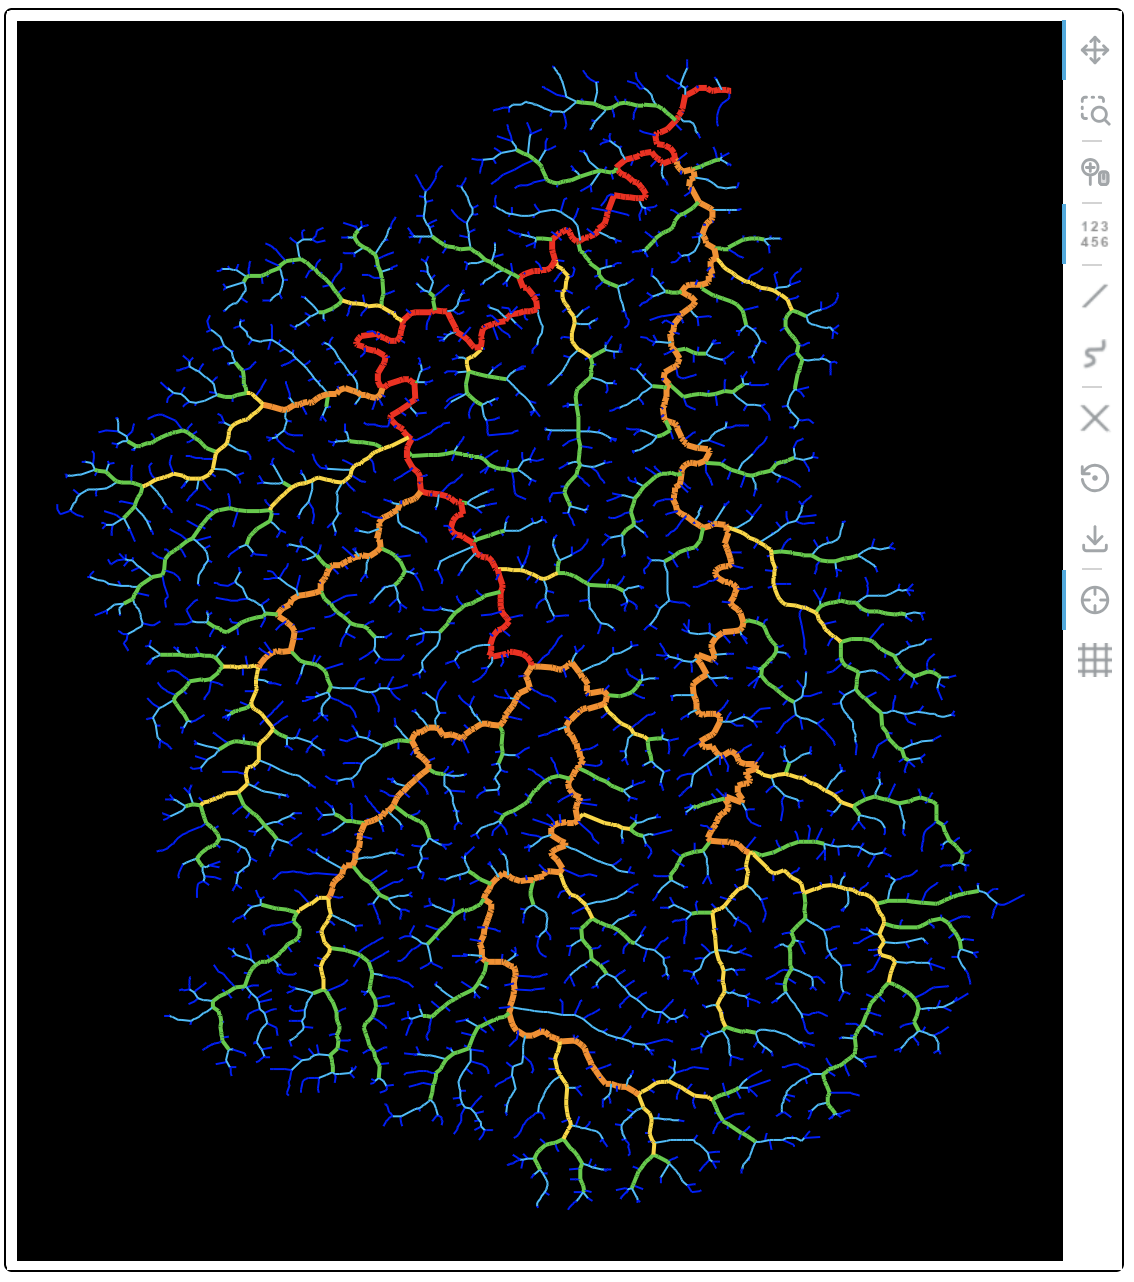
River network in main basin, colors and widths by
Horton-Strahler order.
Hillshaded flow distance to edge and longest channel.
Analysis Tools and Plots - Examples
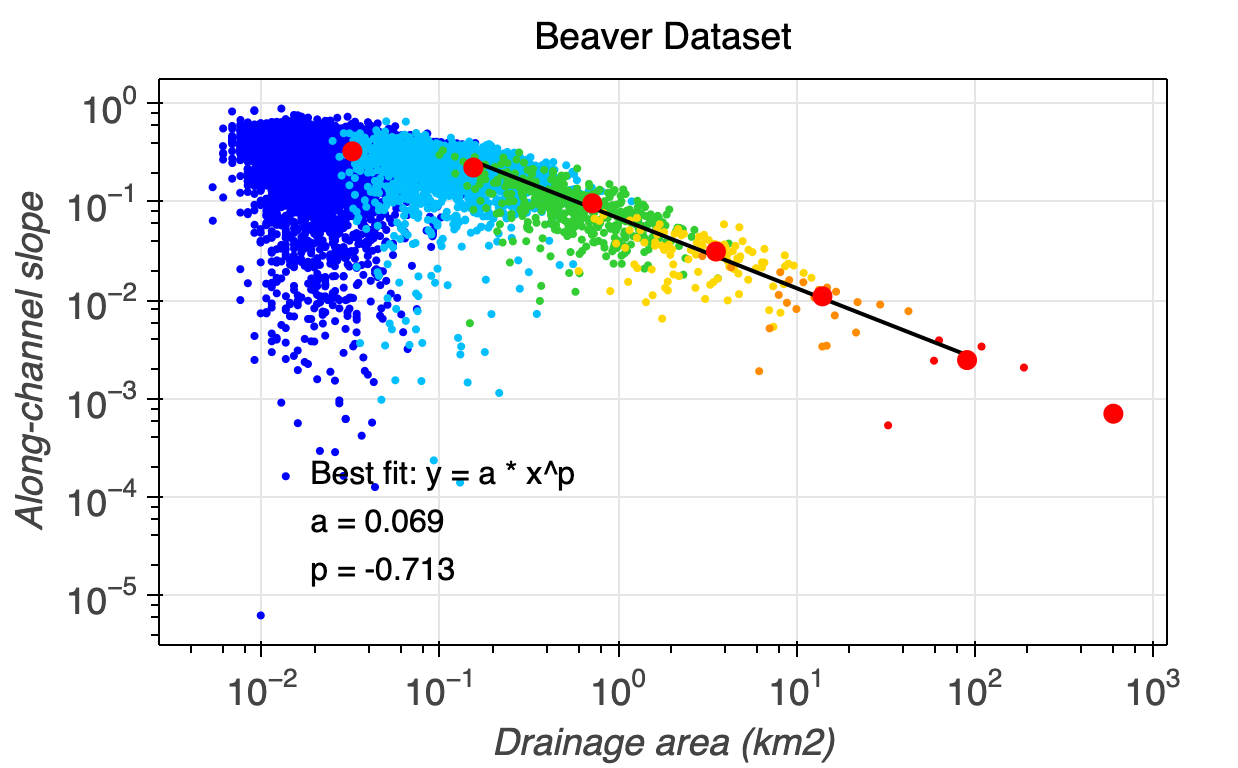
Plot of along-channel slope vs. total contributing area for
all Horton-Strahler streams, colored by order.
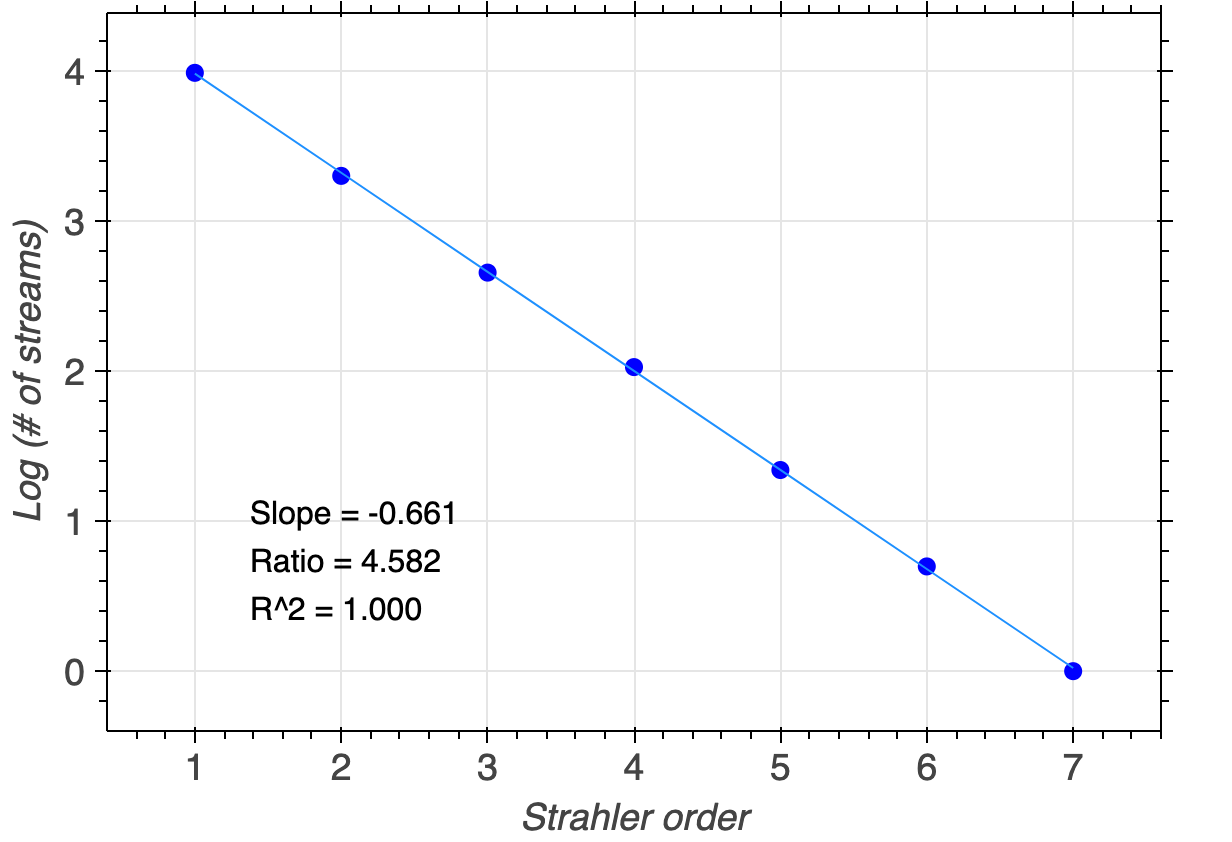
Standard Horton plot, for stream numbers vs. Horton-Strahler
order. Generalized Horton plots are also supported.
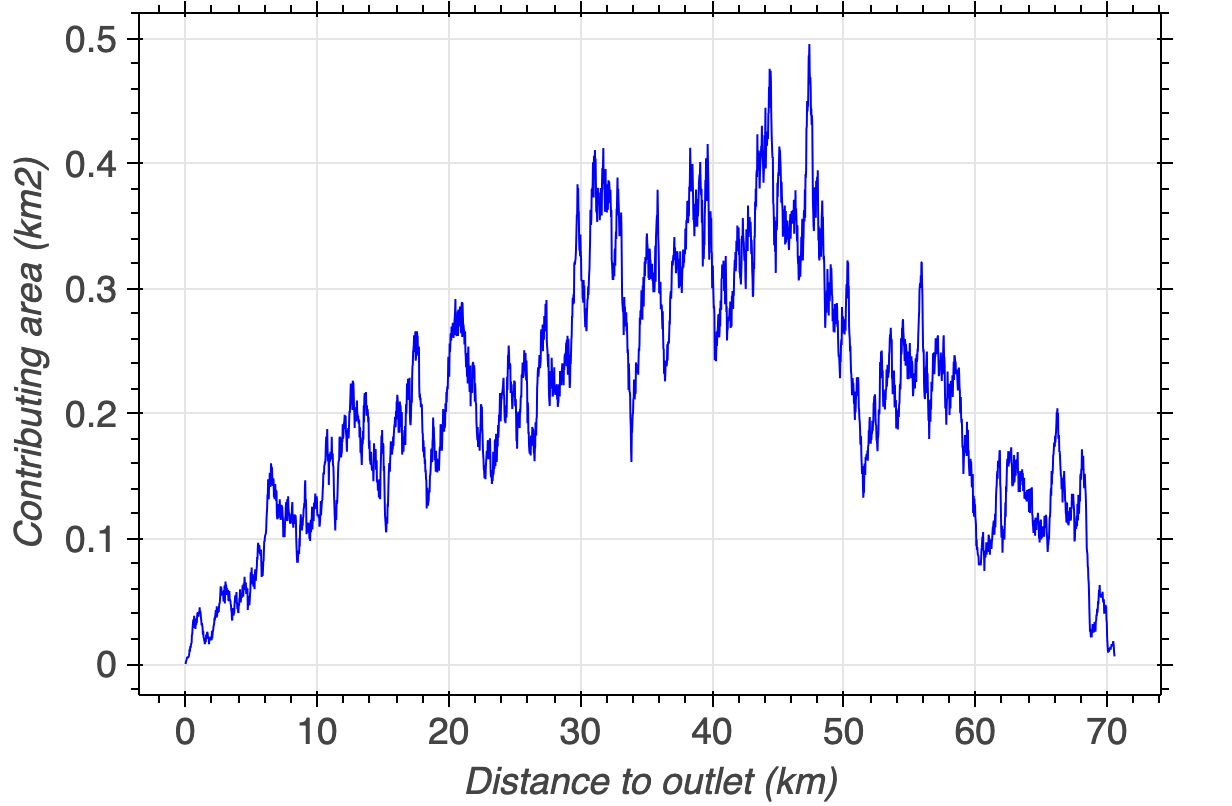
Plot of total contributing area vs. flow distance to the
watershed outlet, line plot.
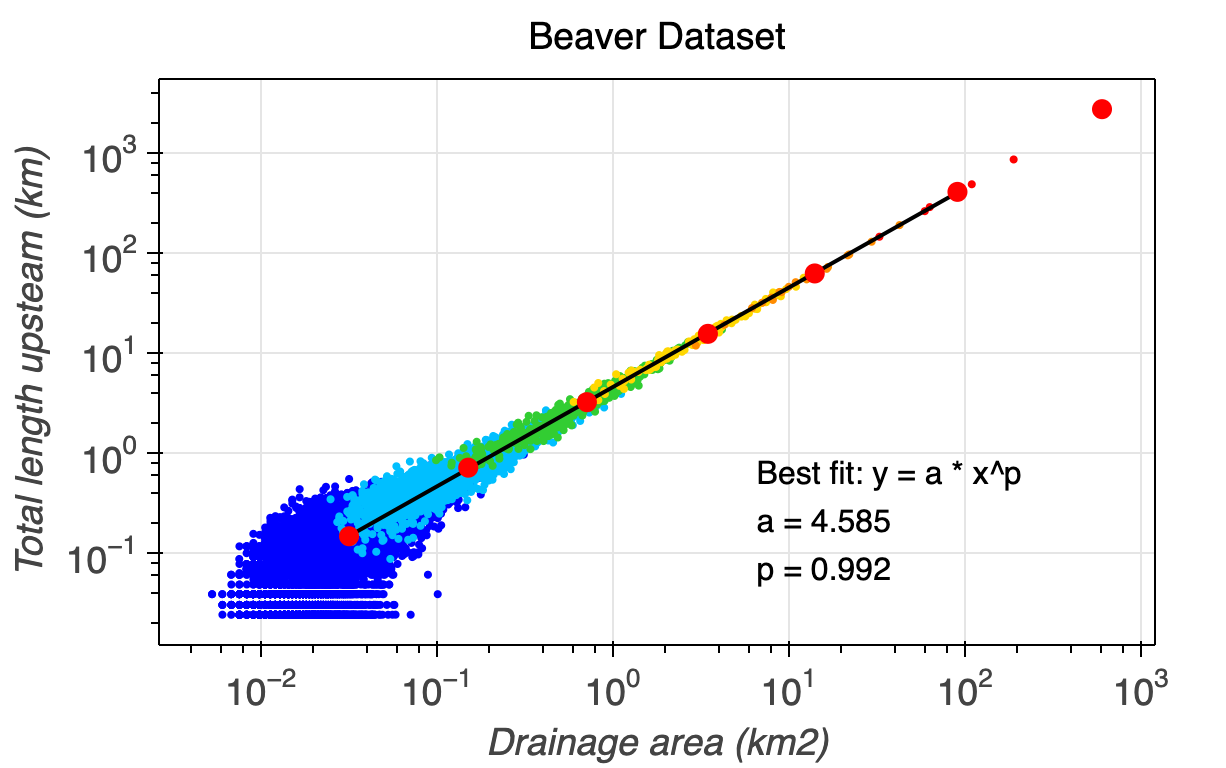
Plot of total channel length vs. total contributing area
for all Horton-Strahler streams, colored by order.
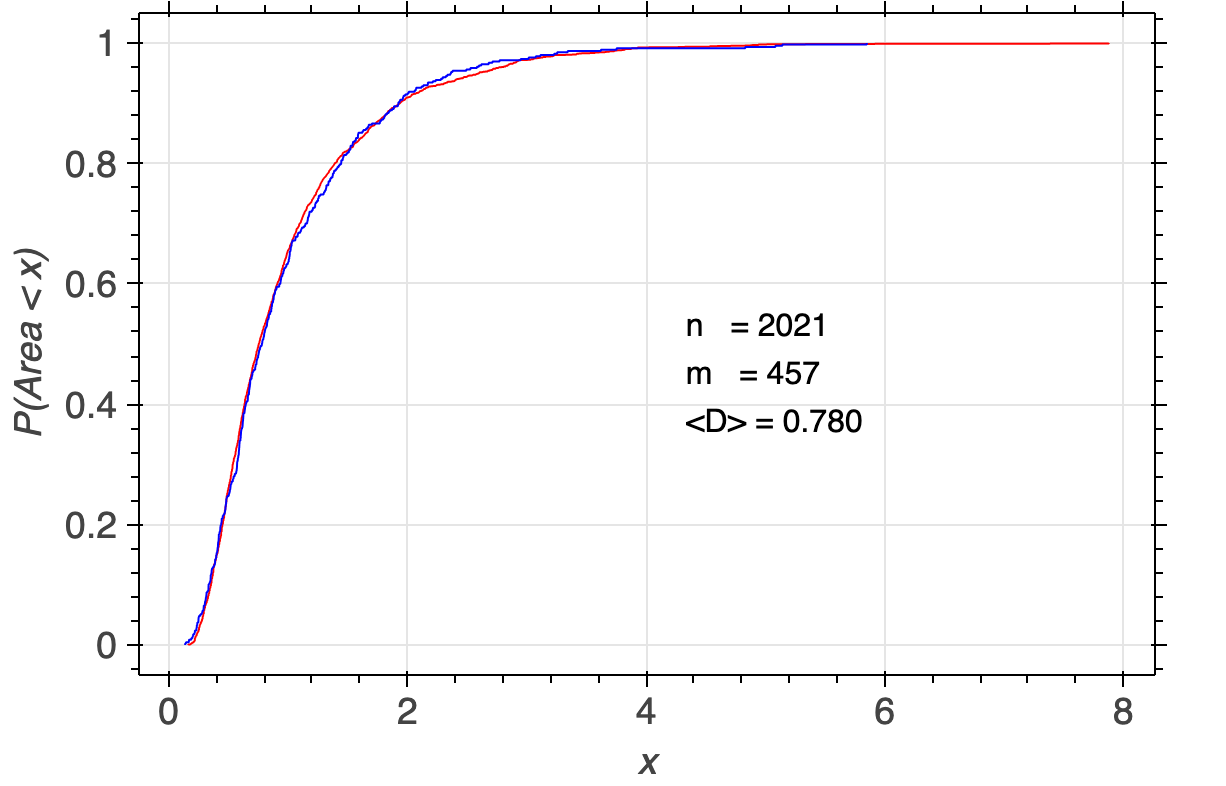
Empirical cumulative distr. functions (ECDFs) for basin
area (by Strahler order) showing statistical self-similarity.
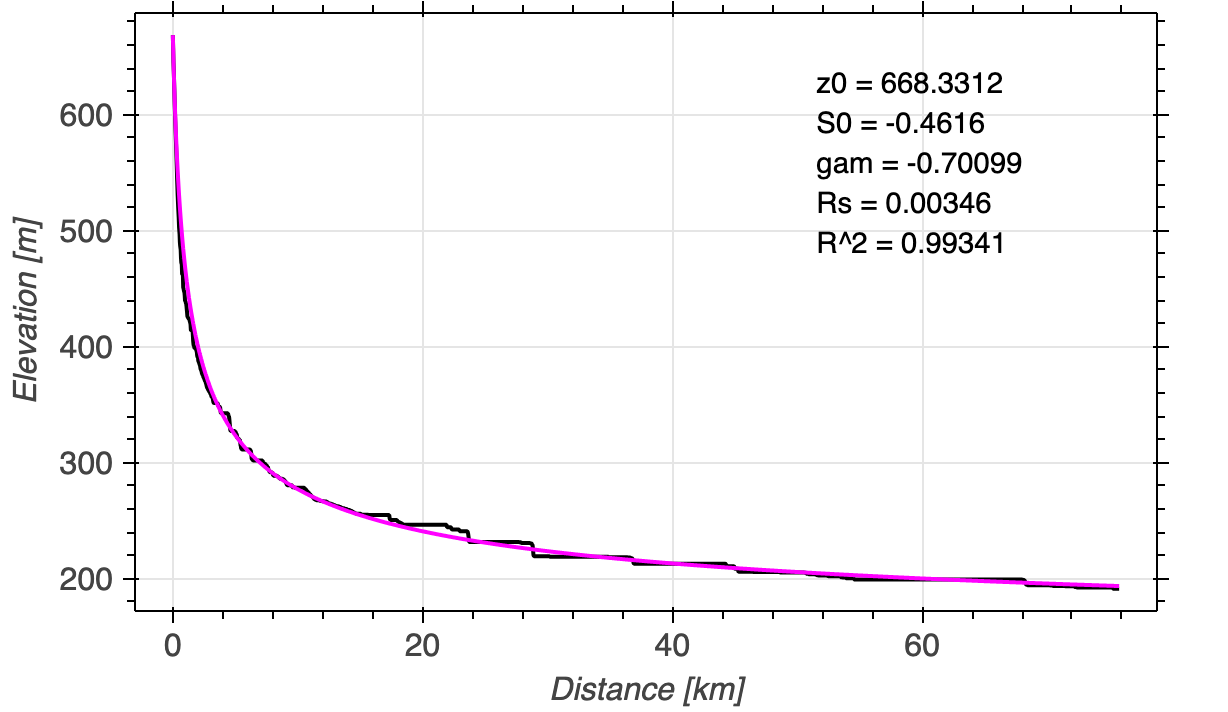
Longitudinal profile plot (elevation vs. distance to outlet)
as measured from DEM, and best-fit to Peckham model.
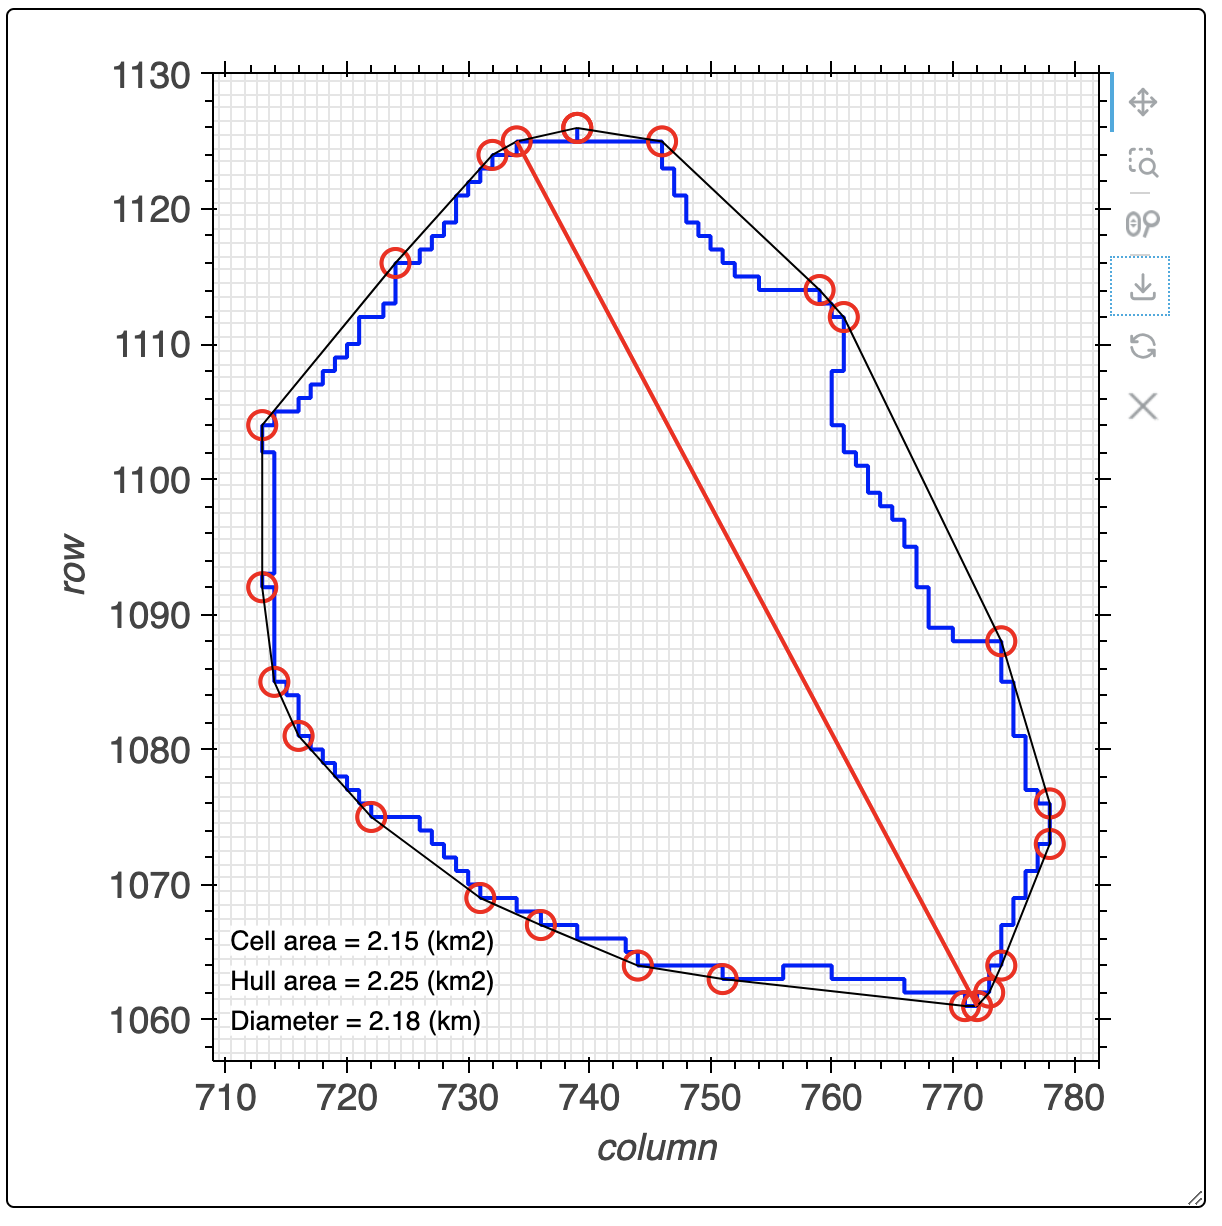
A plot showing shape analysis for an order 3 subbasin with
its convex hull, polygon area, convex hull area, and diameter.
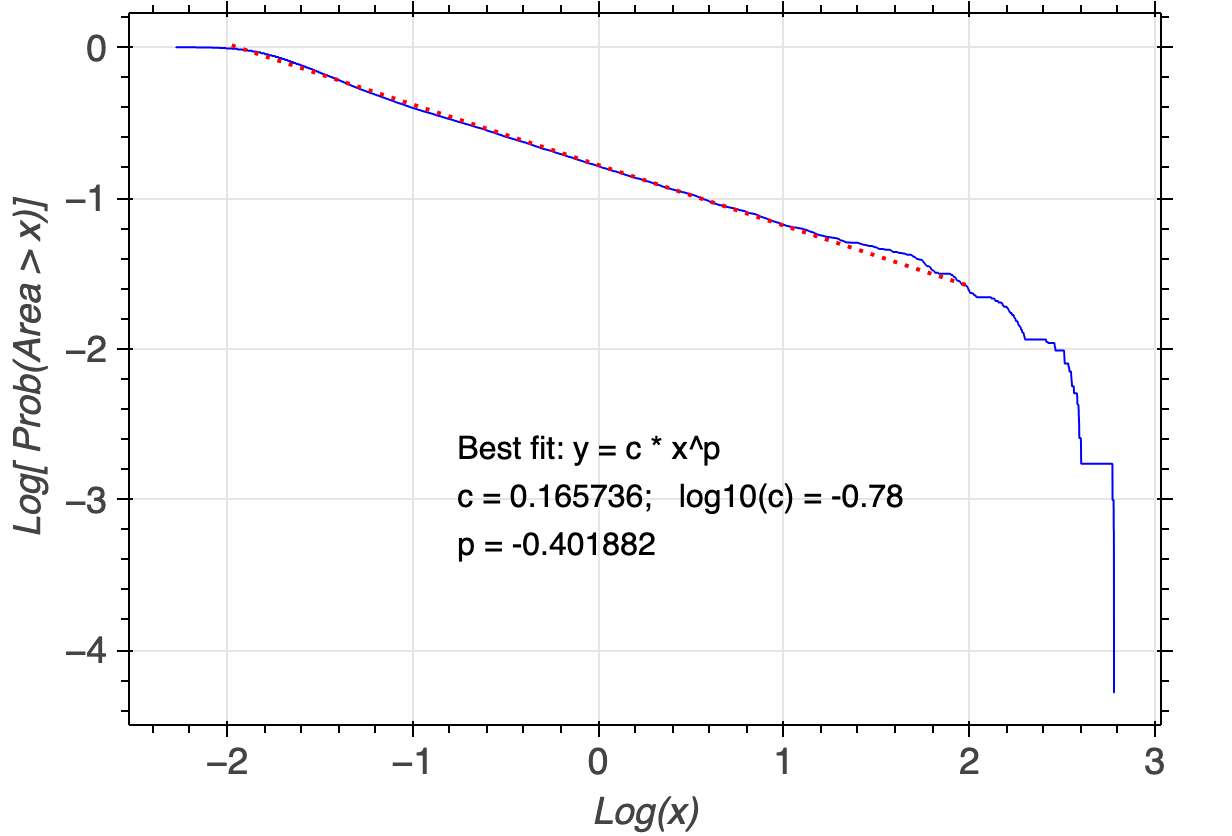
Plot of log[P(Area > x)] vs. log[x] for the total
contributing area to channel links.
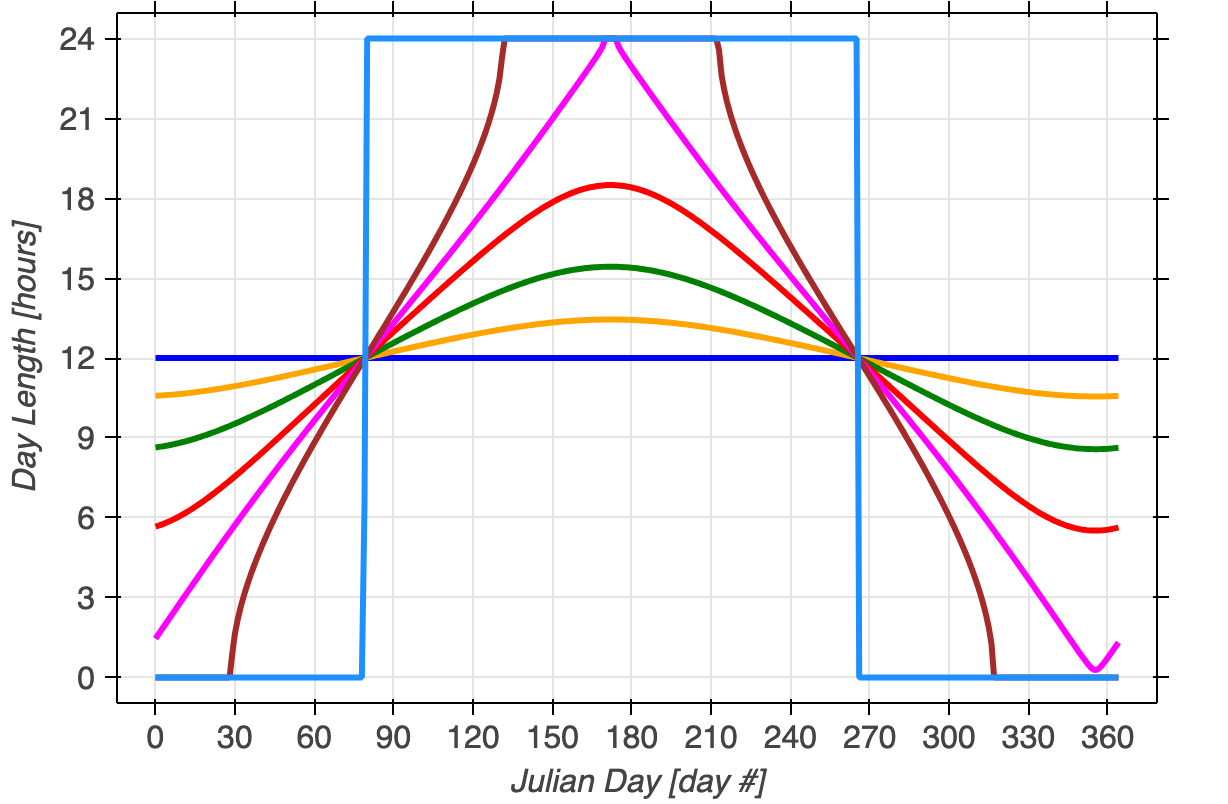
Plot of day length vs. Julian day of the year for
several different latitudes.
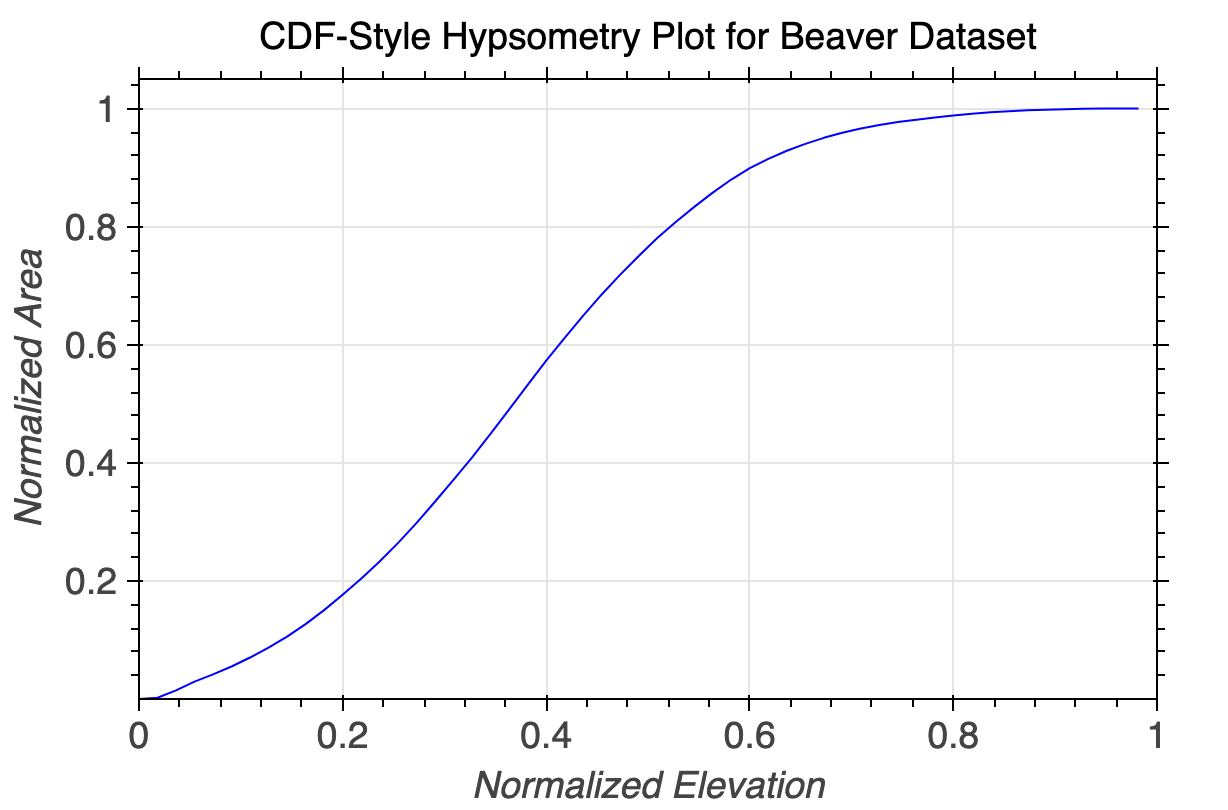
A CDF-style hypsometric plot (area vs. elevation) for
the Beaver Creek DEM.
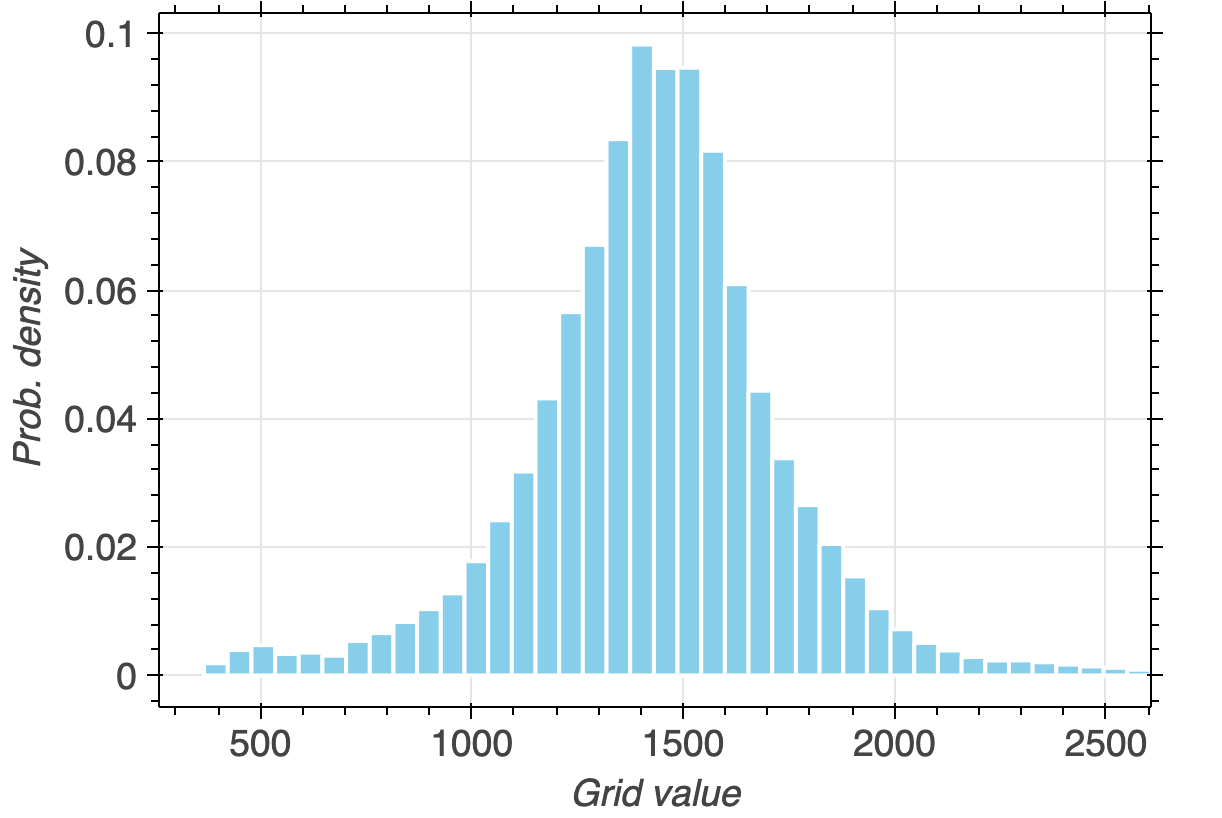
Probability density function of elevations in the Jing
River DEM (China).
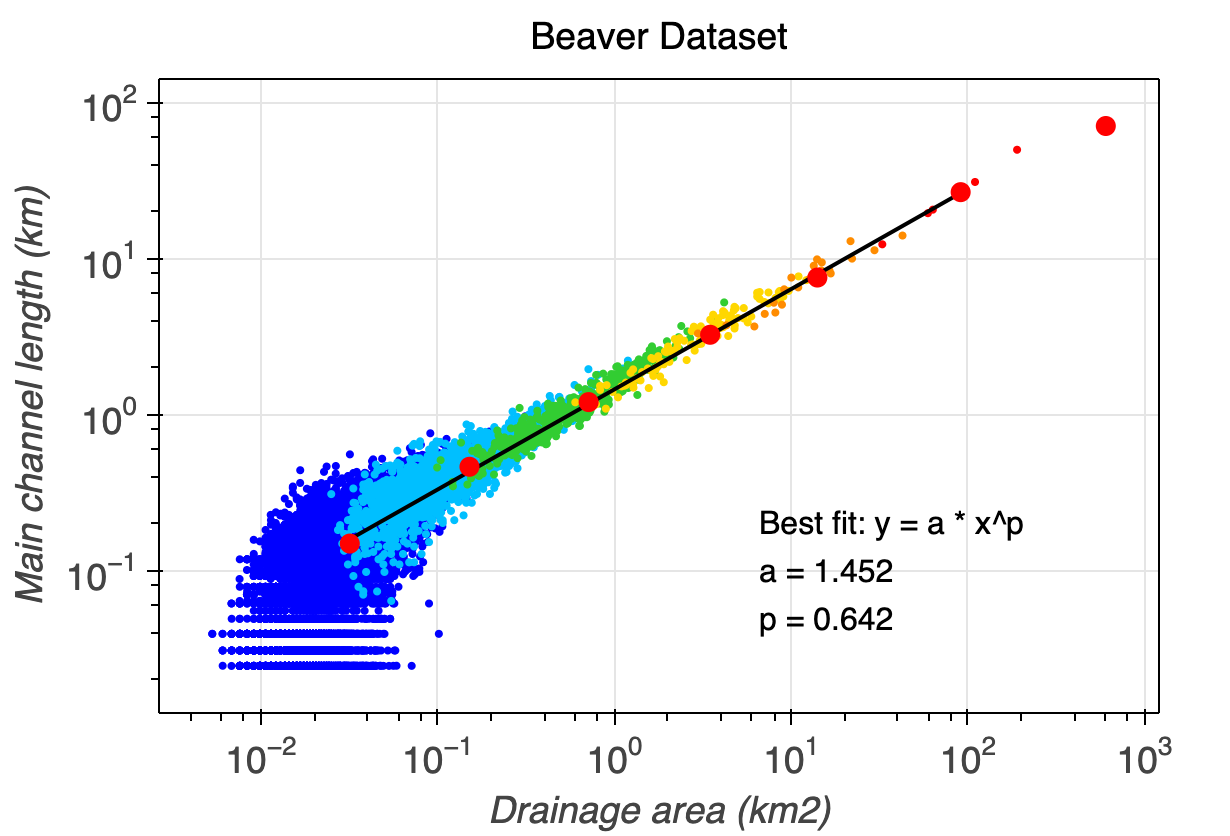
Plot of main channel length vs. total contributing
area for Strahler streams, with best-fit power of 0.64 (Hack's Law).
HTML Help System
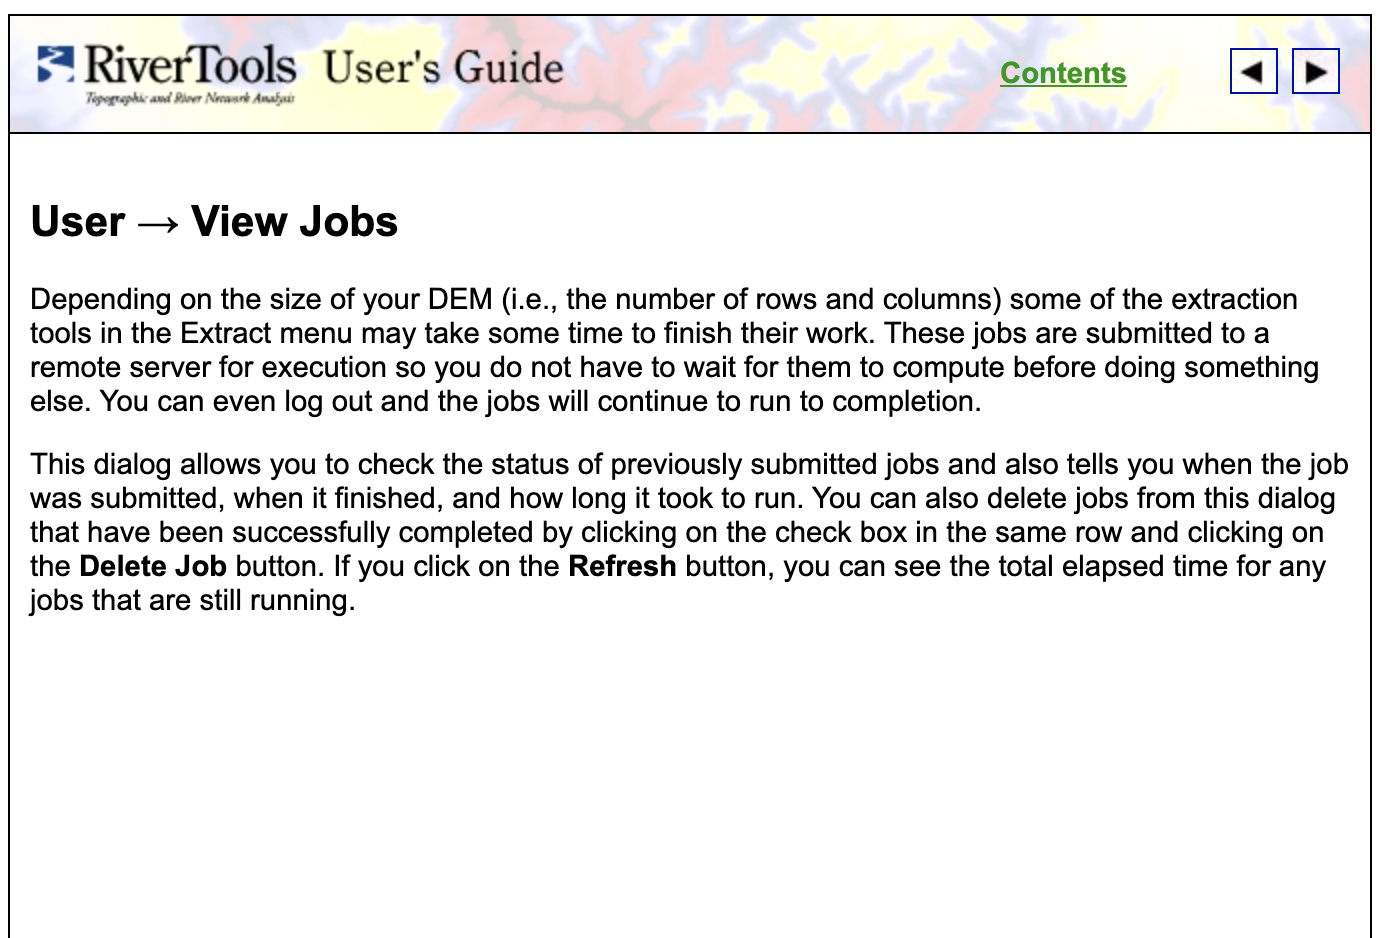
Context-specific HTML help page for the User > View
Jobs dialog. Every dialog has a Help button and HTML help page.
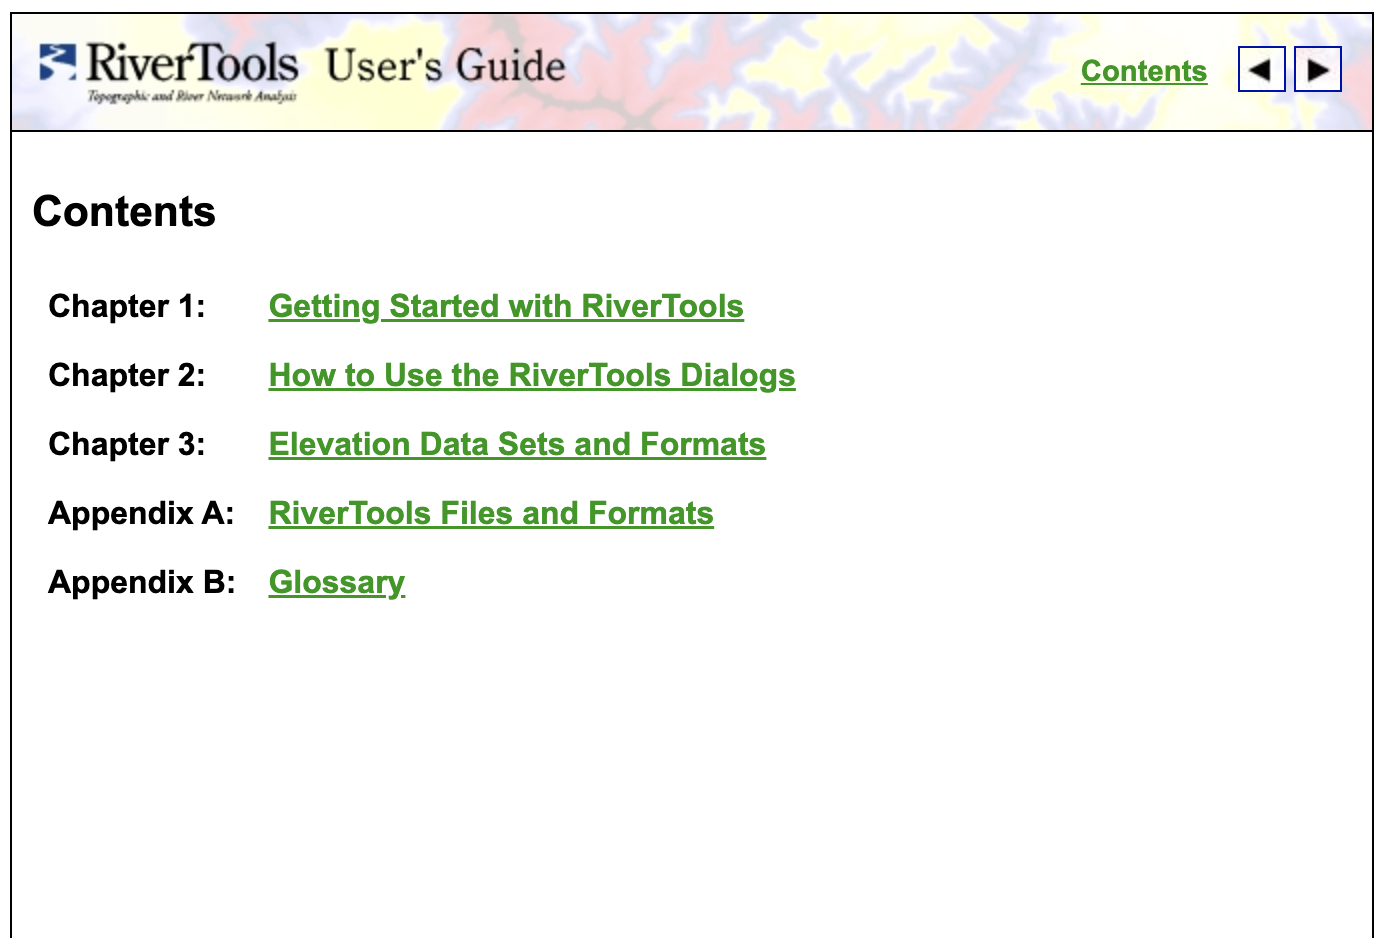
Table of contents for hyper-linked RiverTools User
Guide.
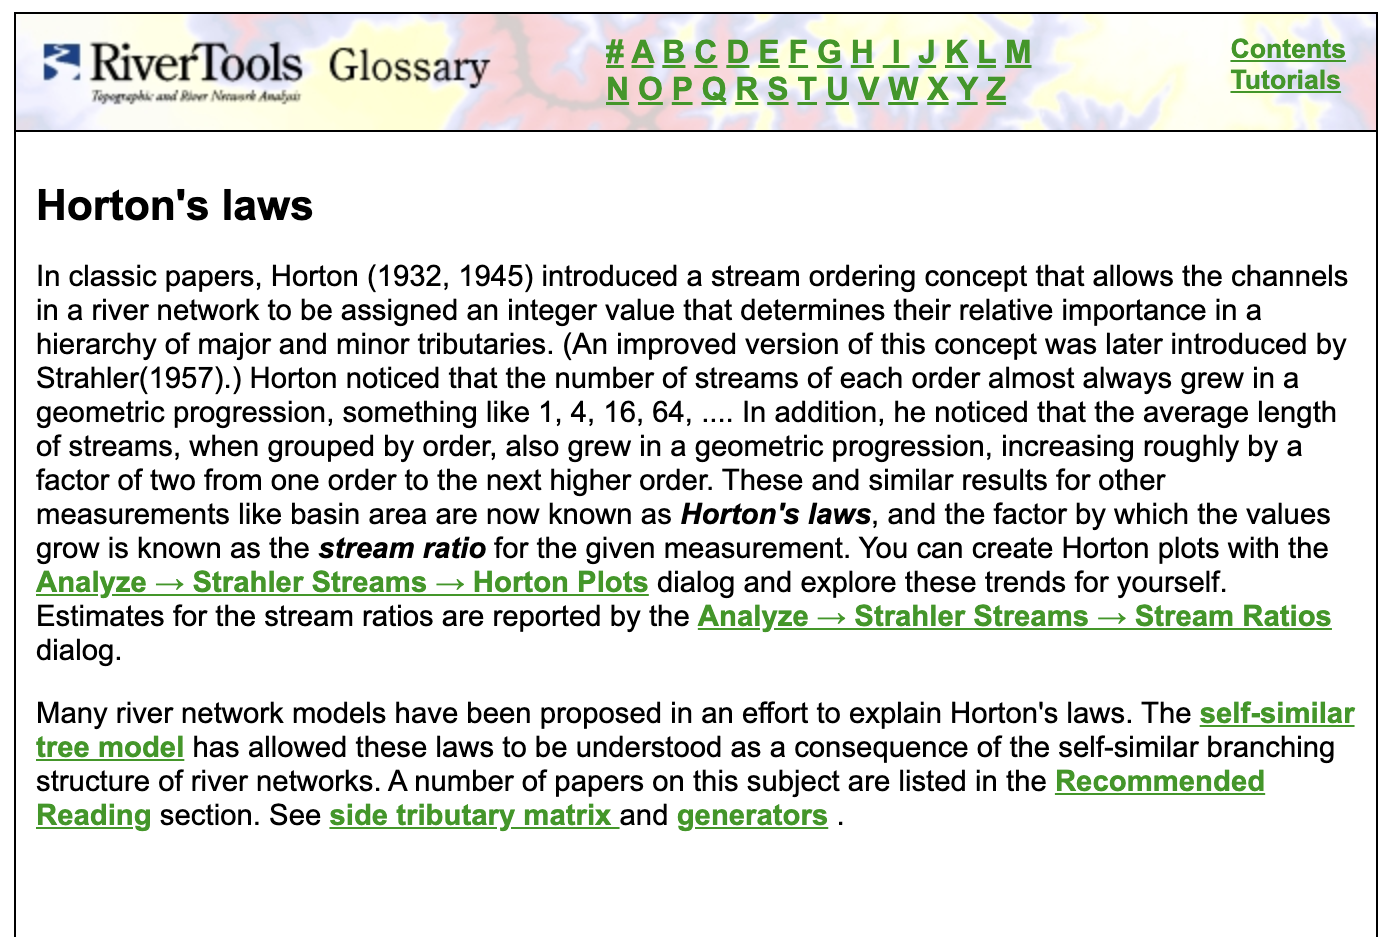
A page from the RiverTools Glossary that explains
Horton's Laws.
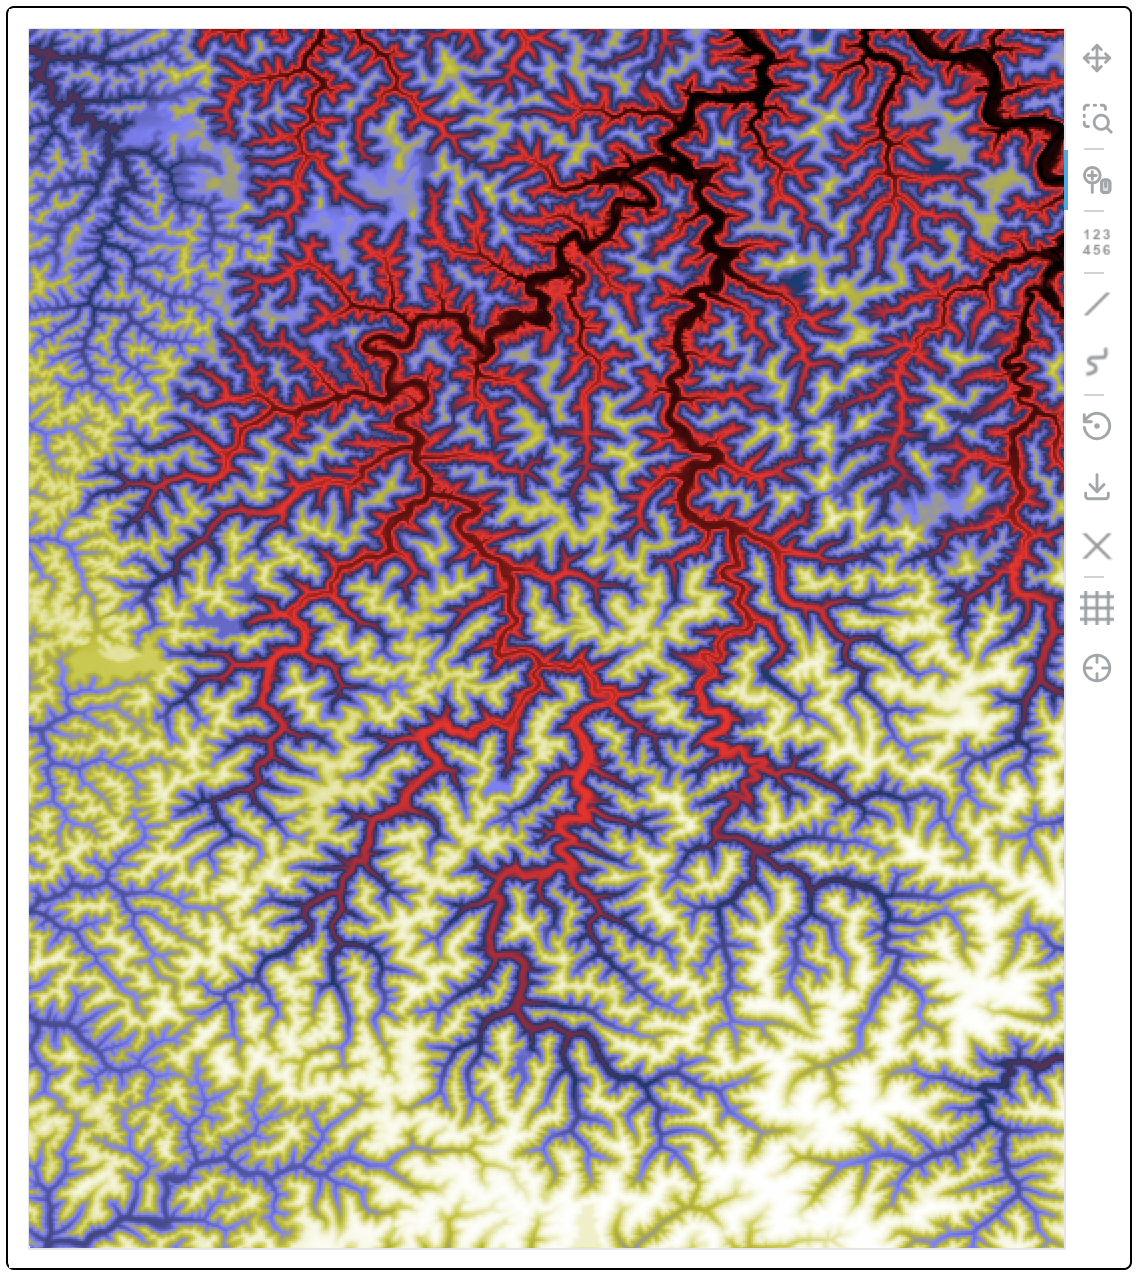
Total Contributing Area (TCA) — Rivix Mass Flux Method vs. D8 and D-Infinity
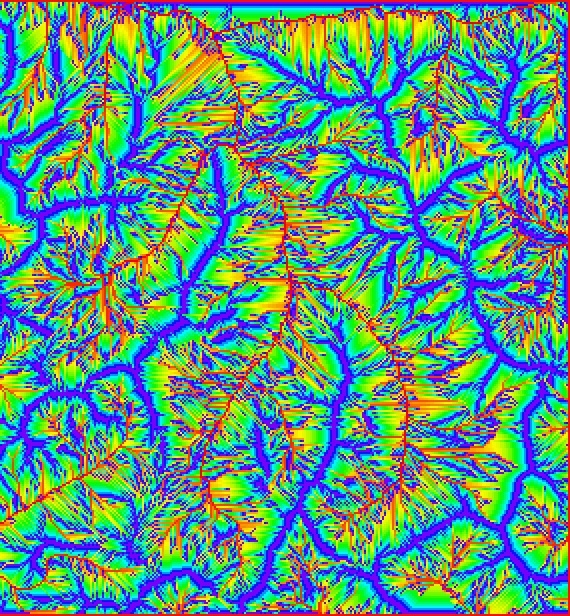
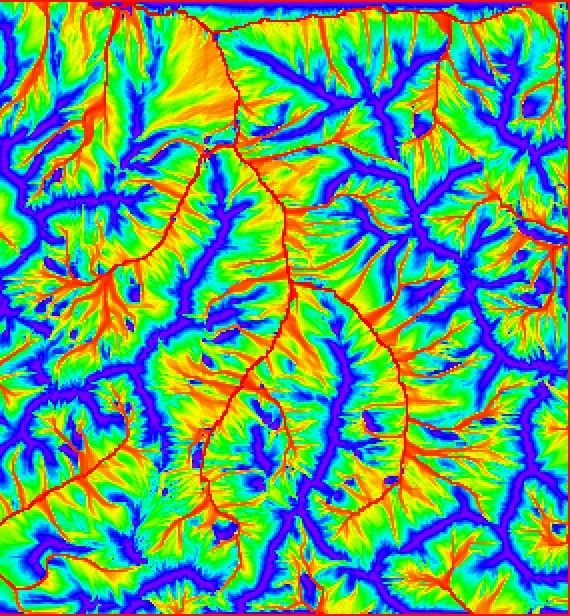
TCA grid for Upper Snake basin, computed via D8
method. Red for large TCA, blue for small TCA (ridges).
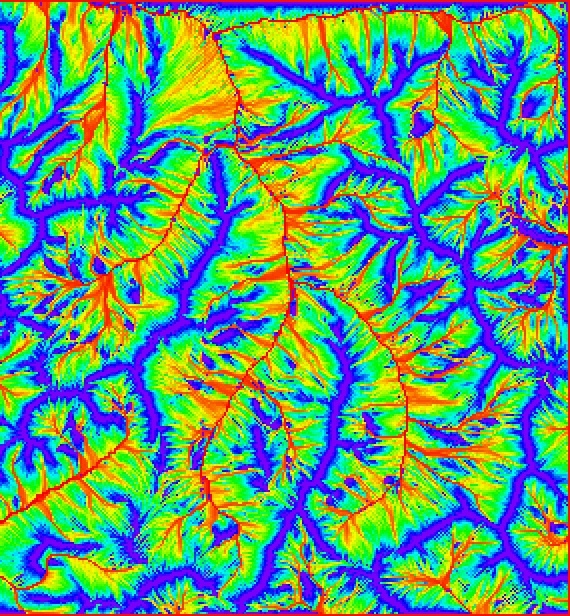
TCA grid for Upper Snake basin, computed via D-Infinity
method. Red for large TCA, blue for small TCA (ridges).
TCA grid for Upper Snake computed via Rivix mass
flux method. Red for large TCA, blue for small TCA (ridges).
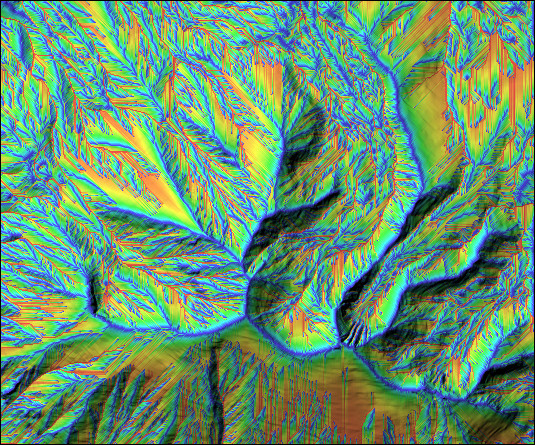
Hillshaded TCA grid for Mount Sopris, computed via
D8 method. Red for large TCA, blue for small TCA (ridges).
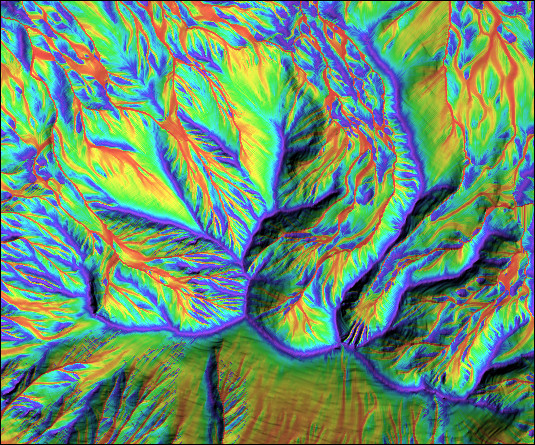
Hillshaded TCA grid for Mount Sopris, computed via
D-Infinity method. Red for large TCA, blue for small TCA (ridges).
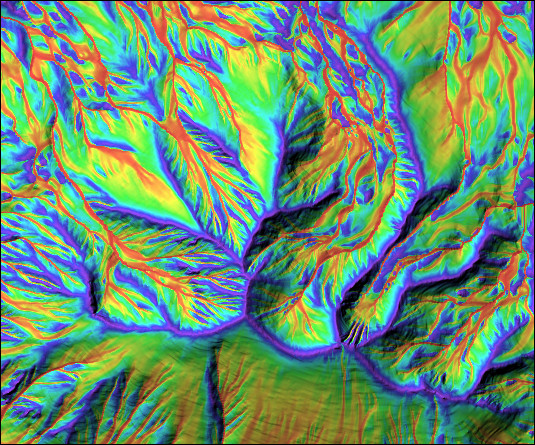
Hillshaded TCA grid for Mount Sopris computed via Rivix
mass flux method. Red for large TCA, blue for small TCA.
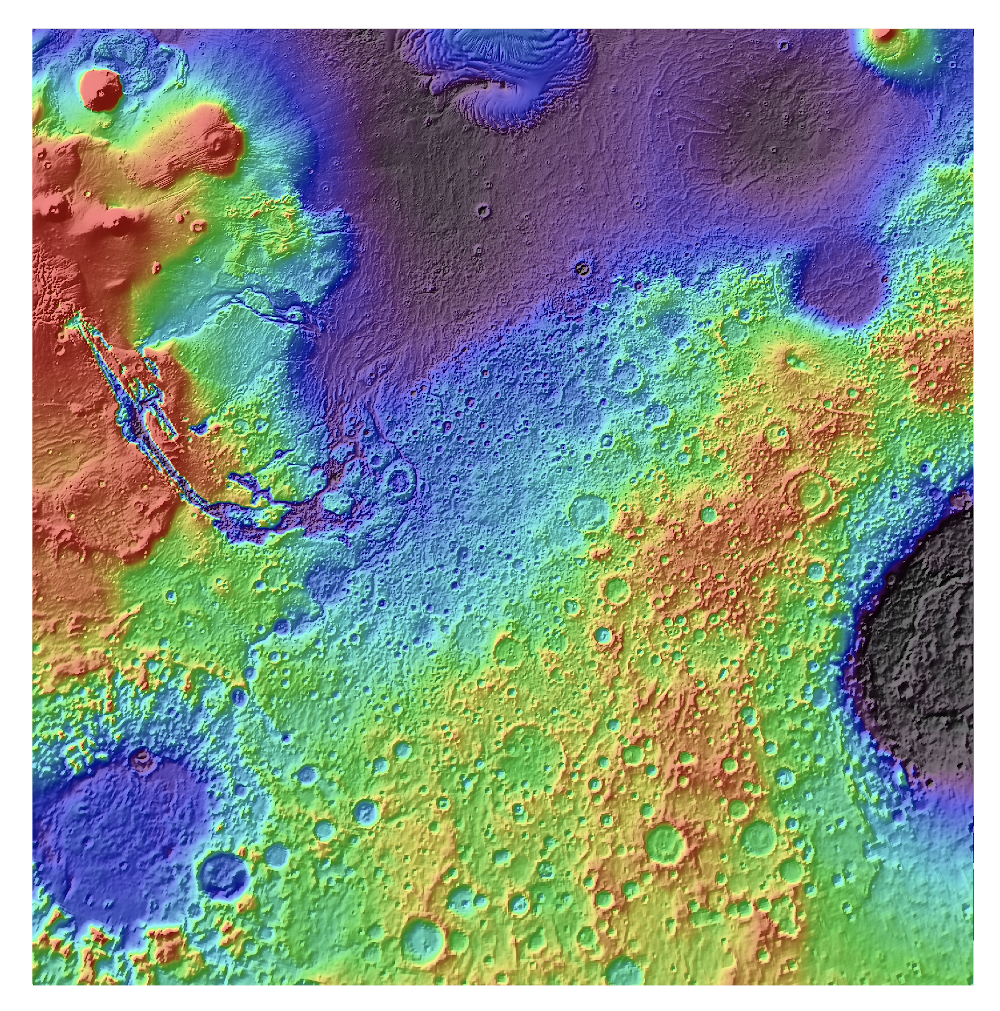
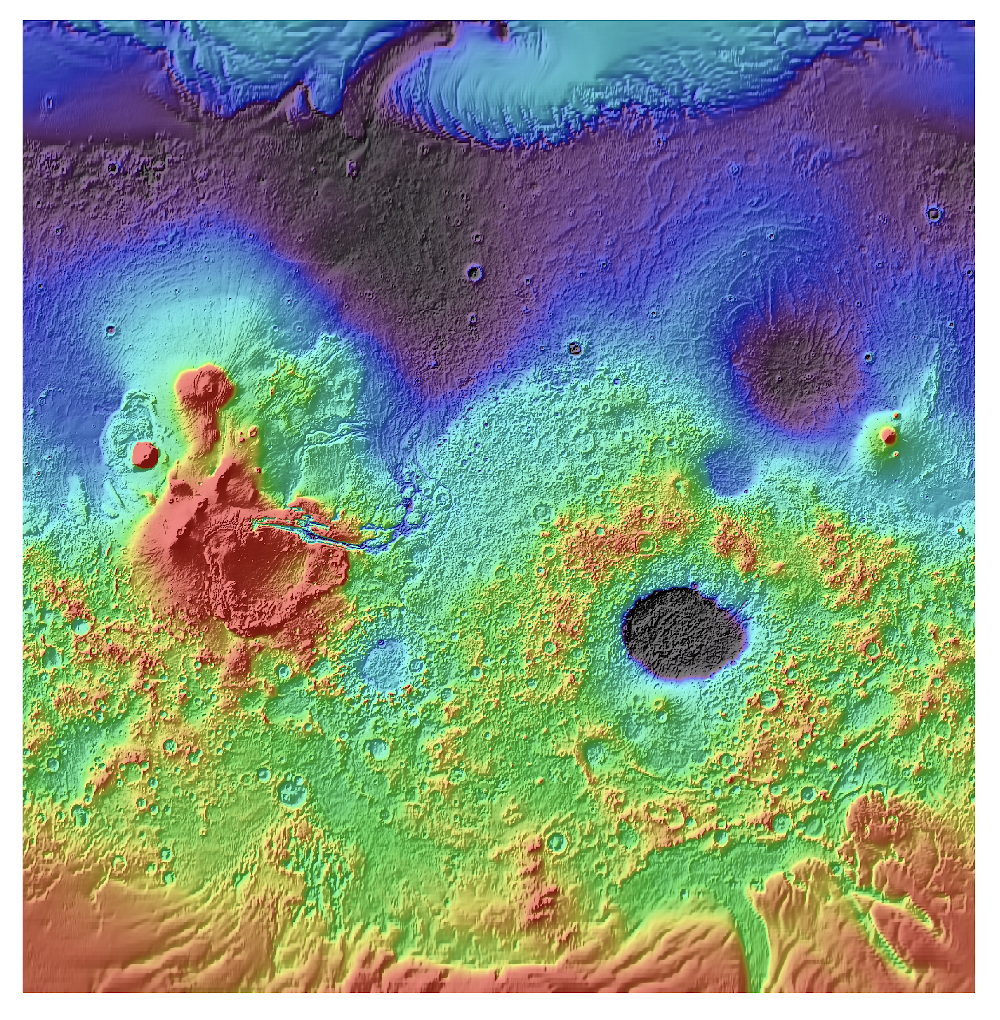
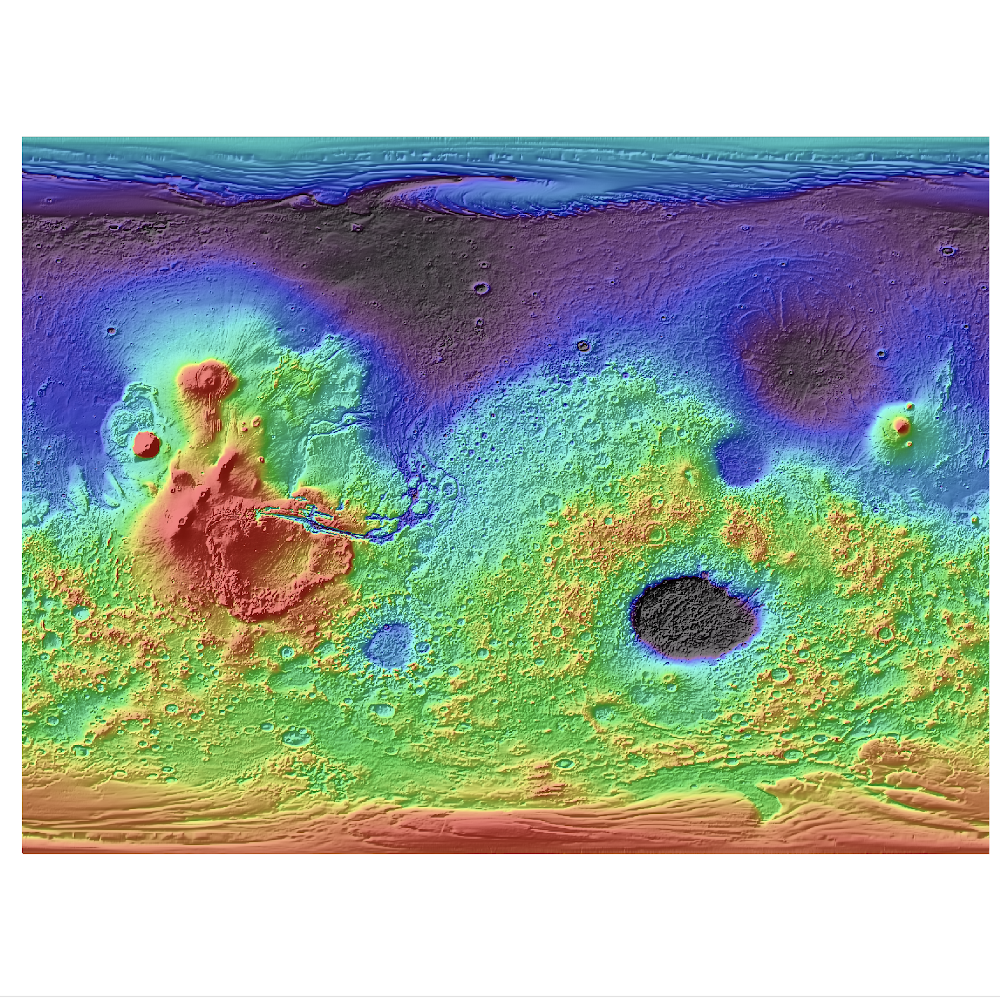
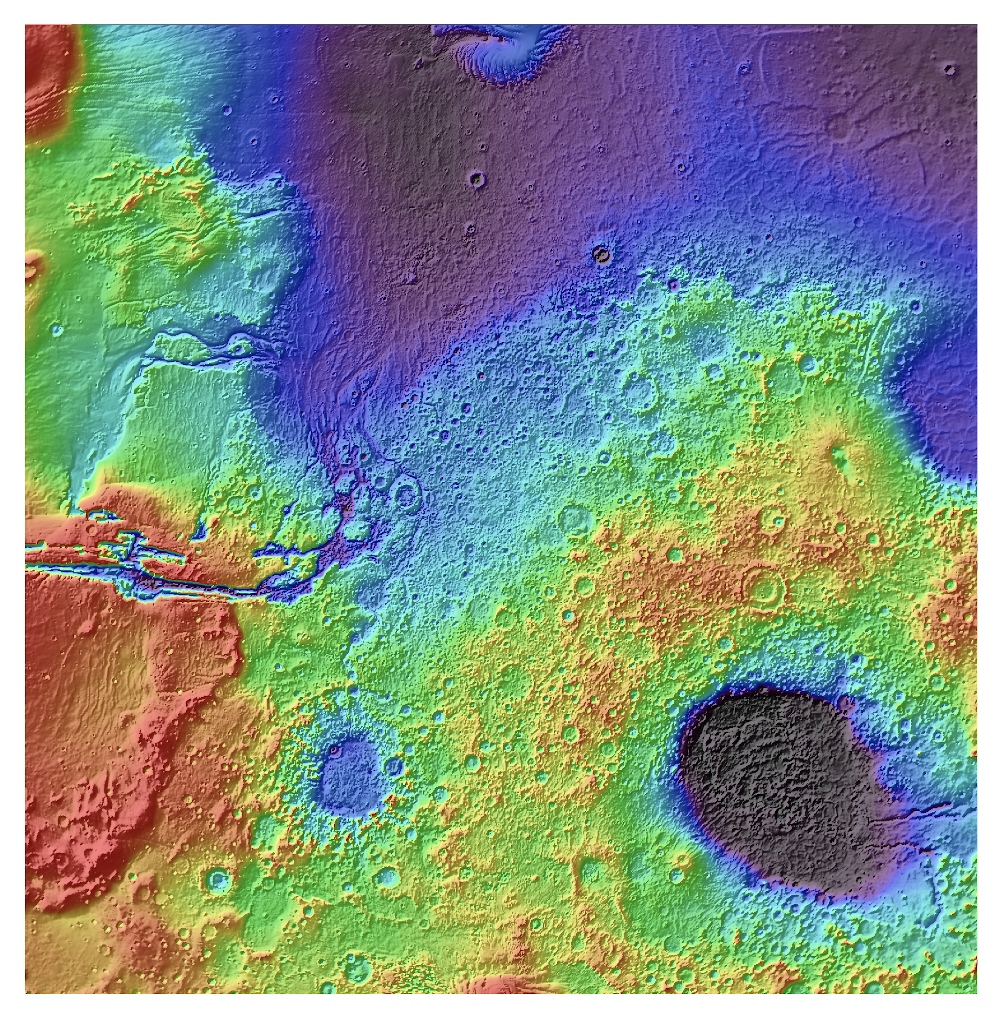
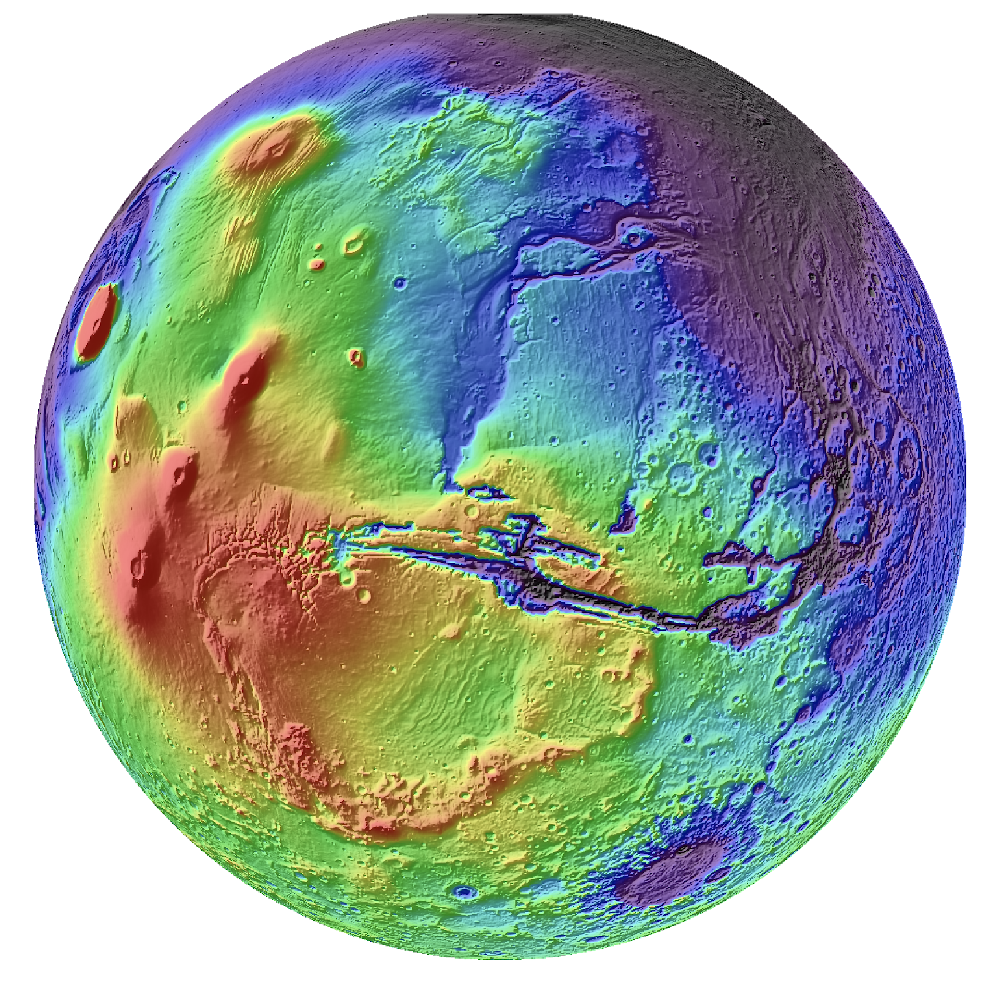
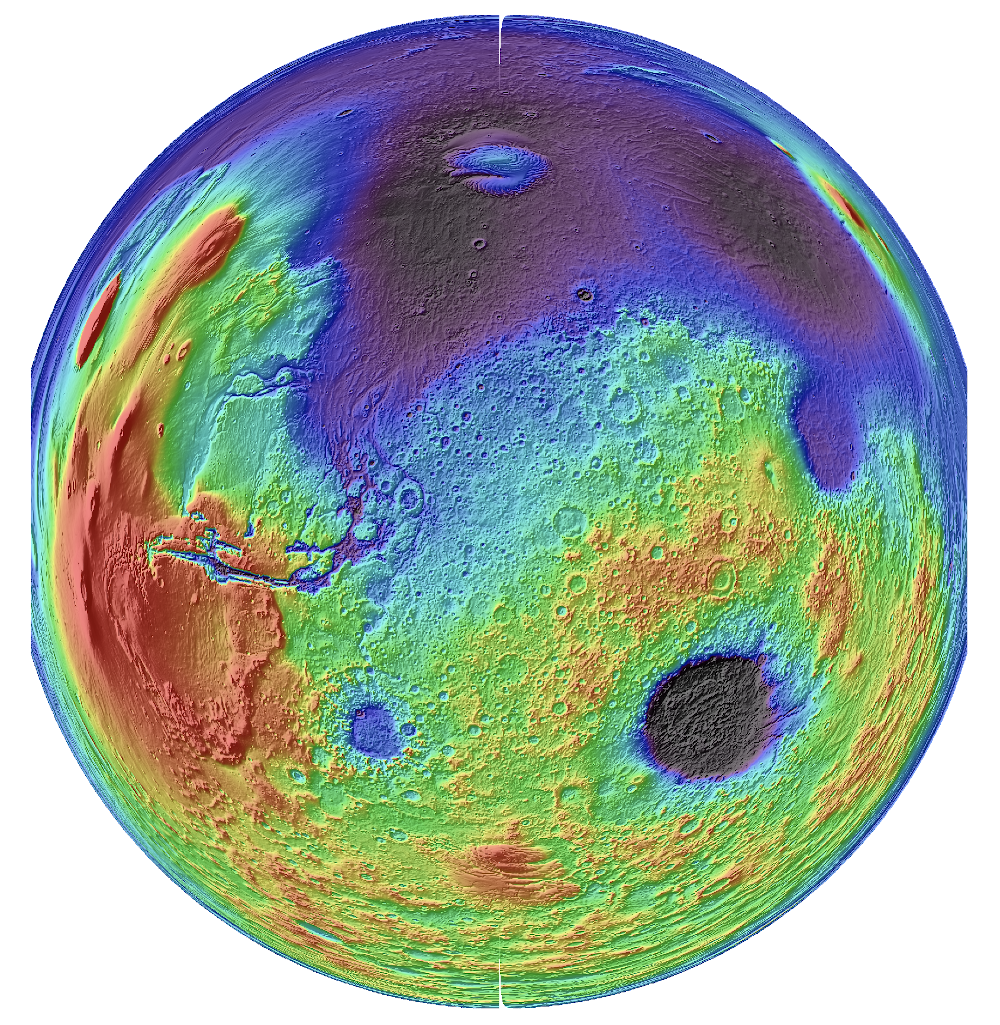
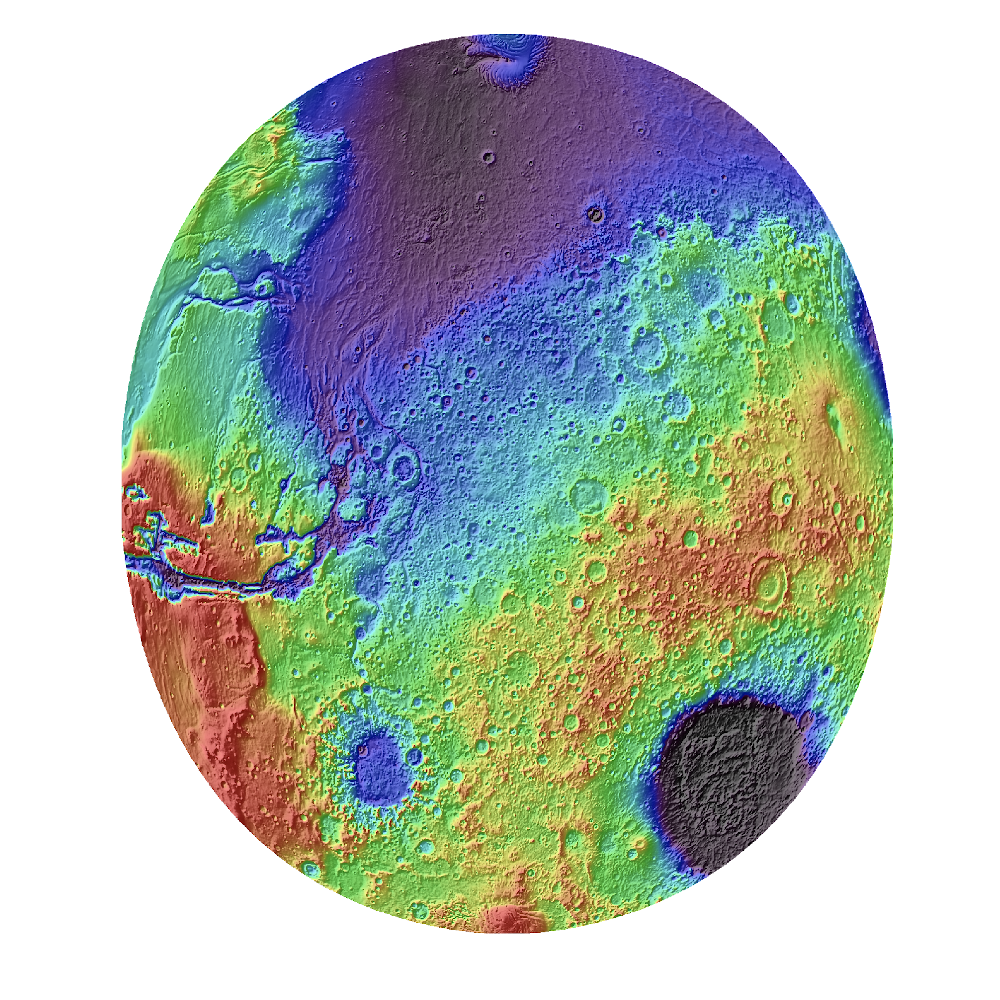
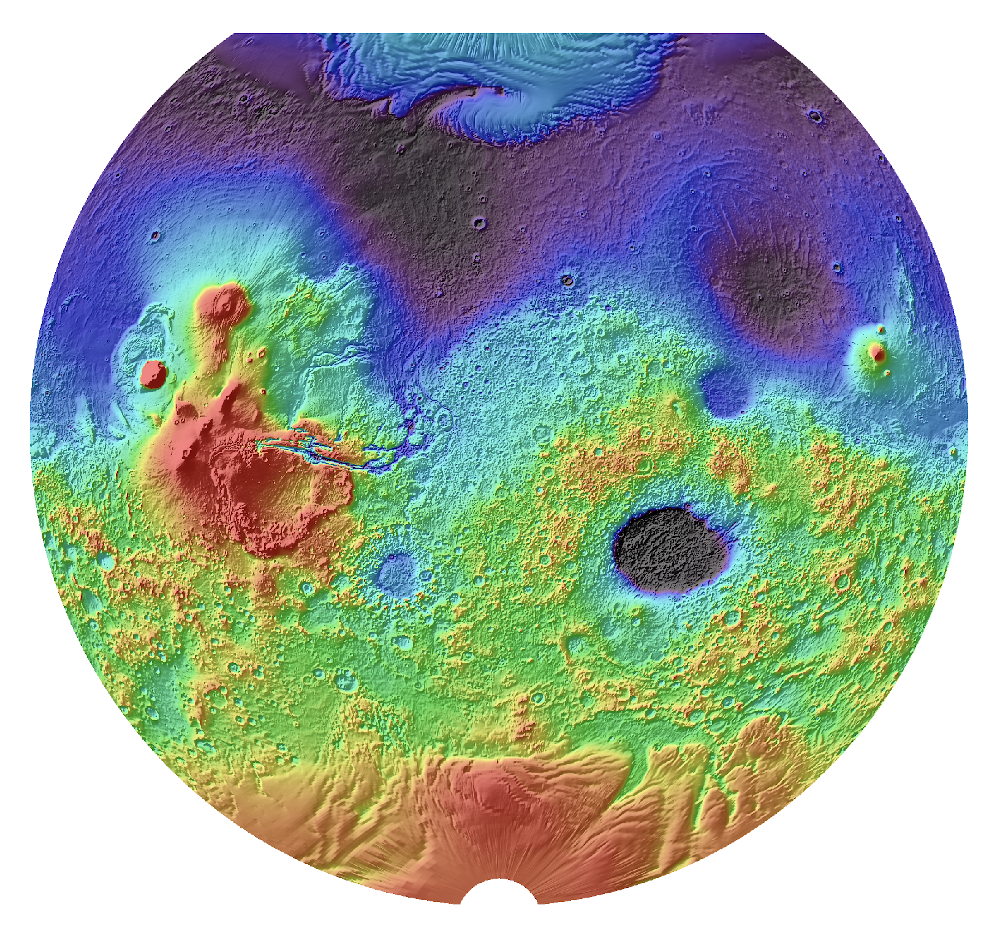
Map Projections of Mars MOLA Shaded Relief
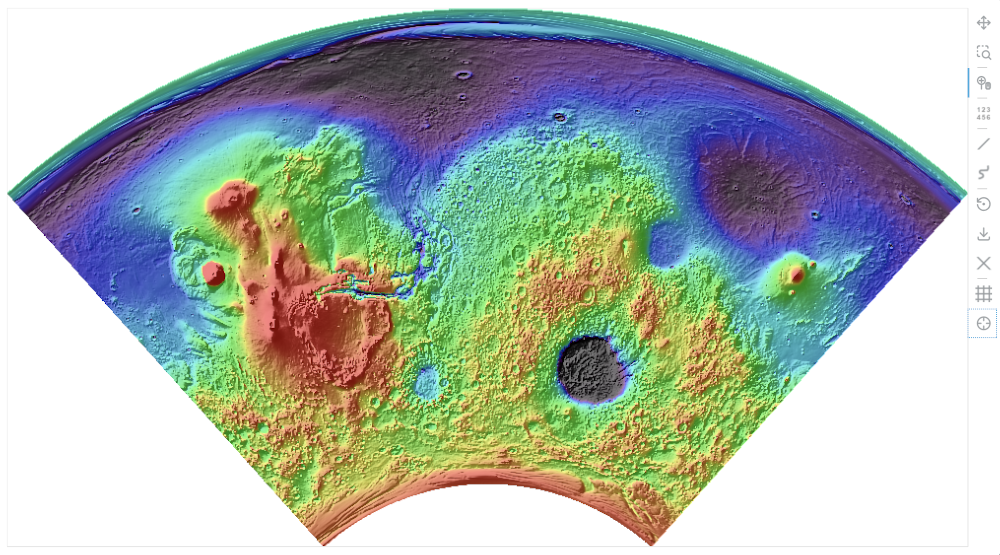
Equidistant Conic 2 projection (-60,30)
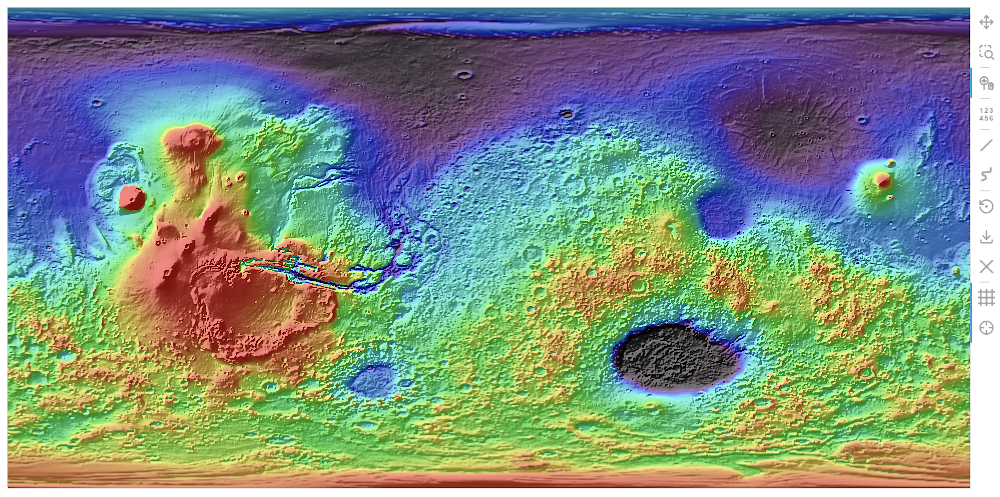
Equidistant Cylindrical projection
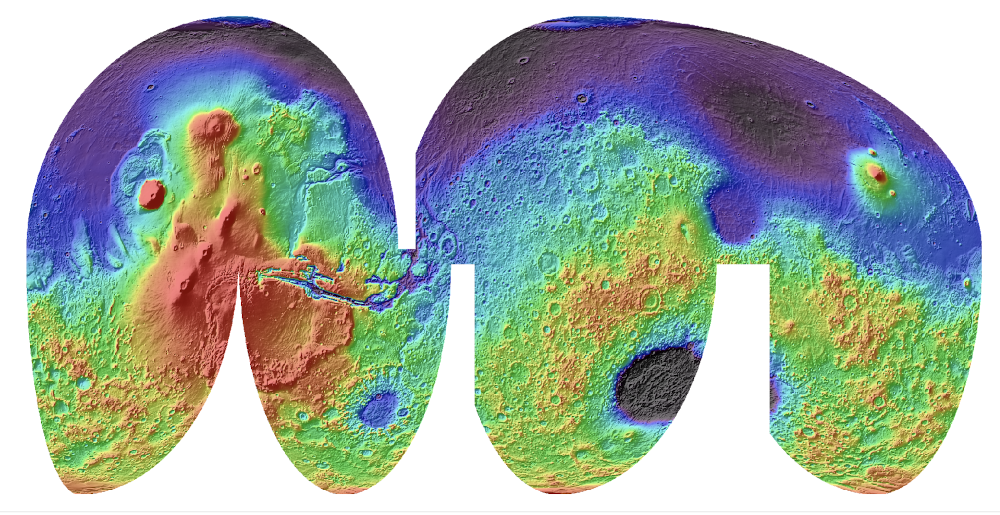
Interrupted Mollweide projection
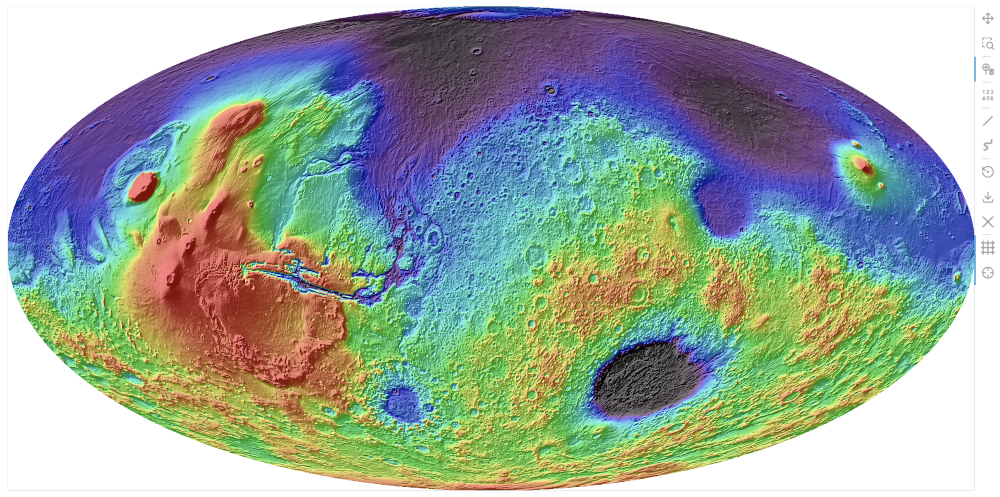
Mollweide projection
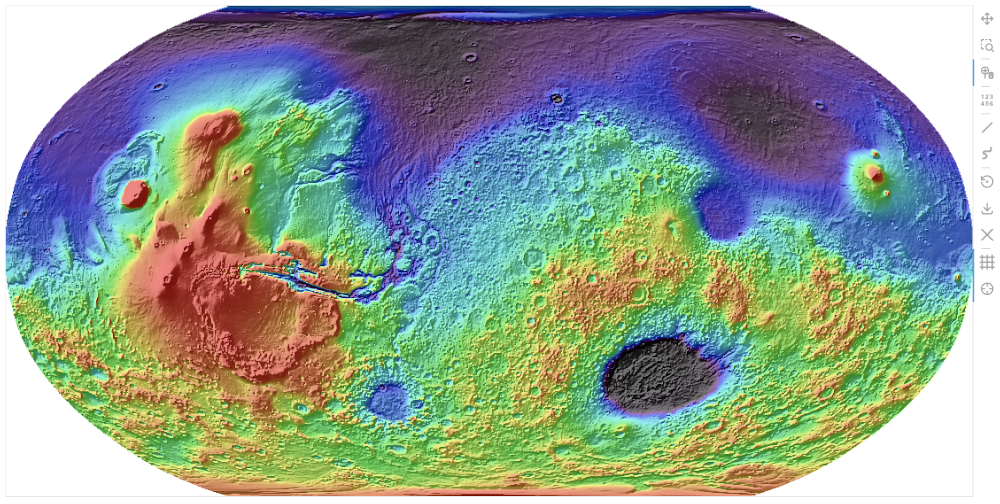
Robinson projection
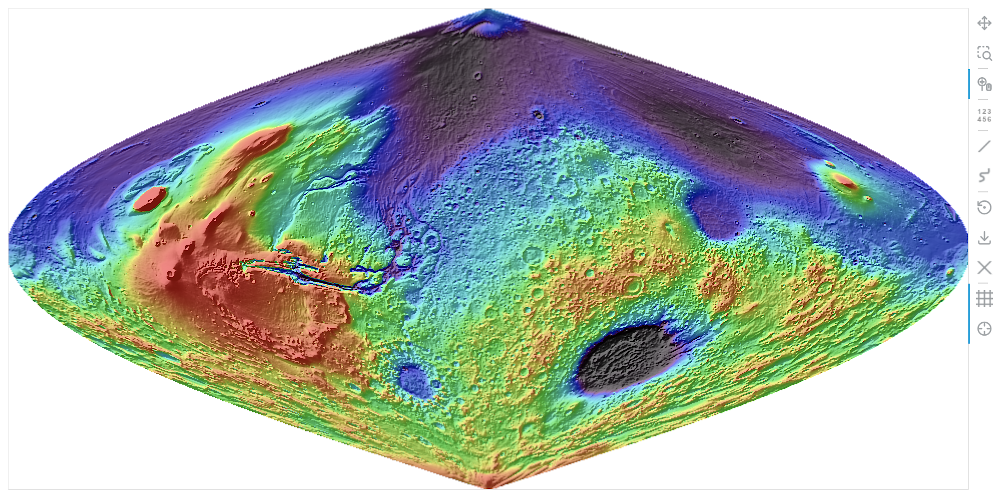
Sinusoidal projection
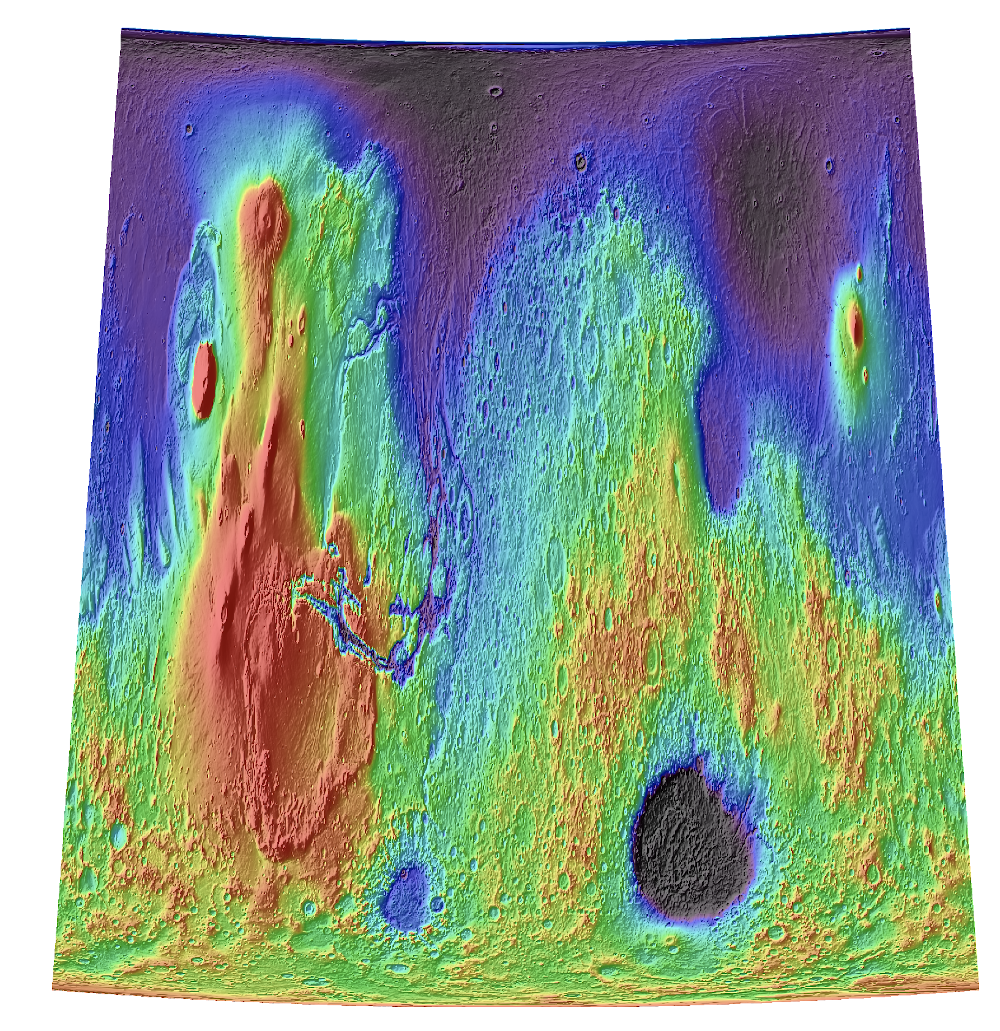
Albers Equal Area projection (-55,60)
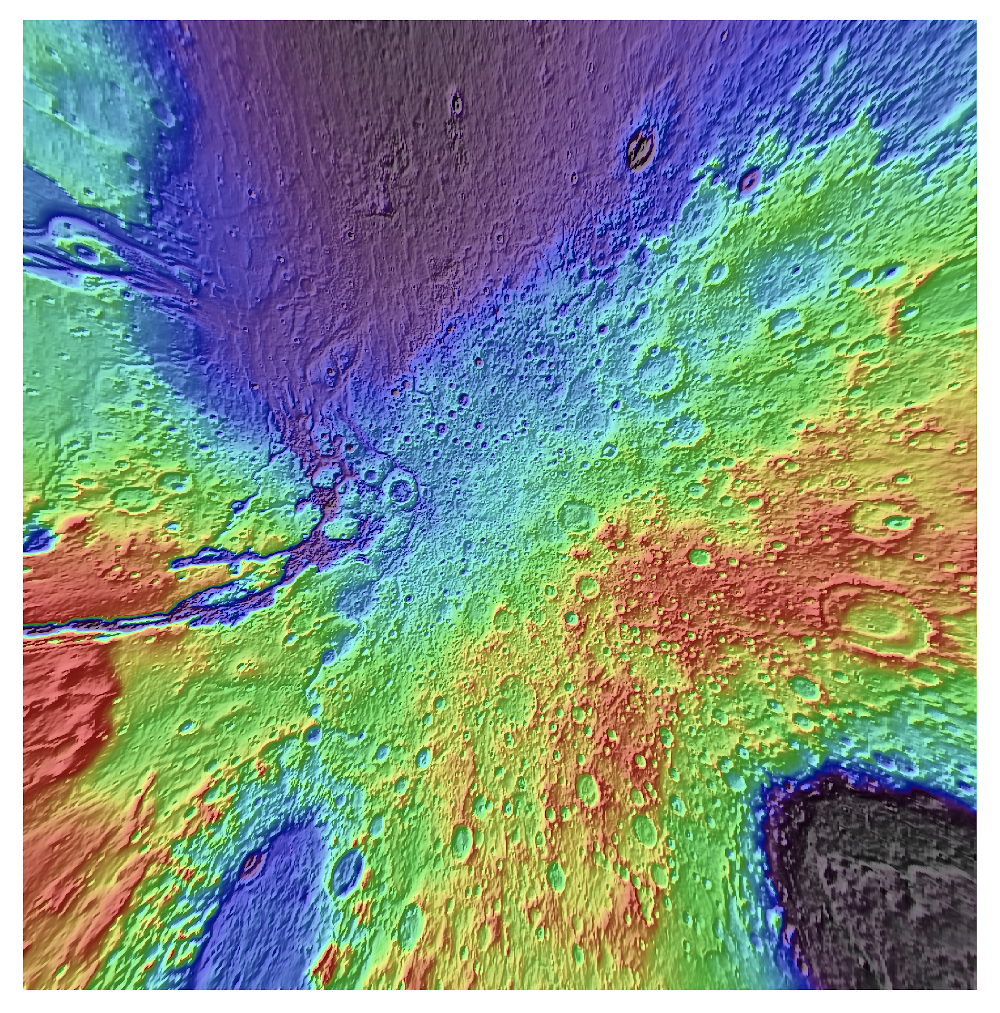
Gnomonic projection (< 1 hemisphere)
Lambert Conformal Conic projection
Mercator projection
Miller projection
Stereographic projection
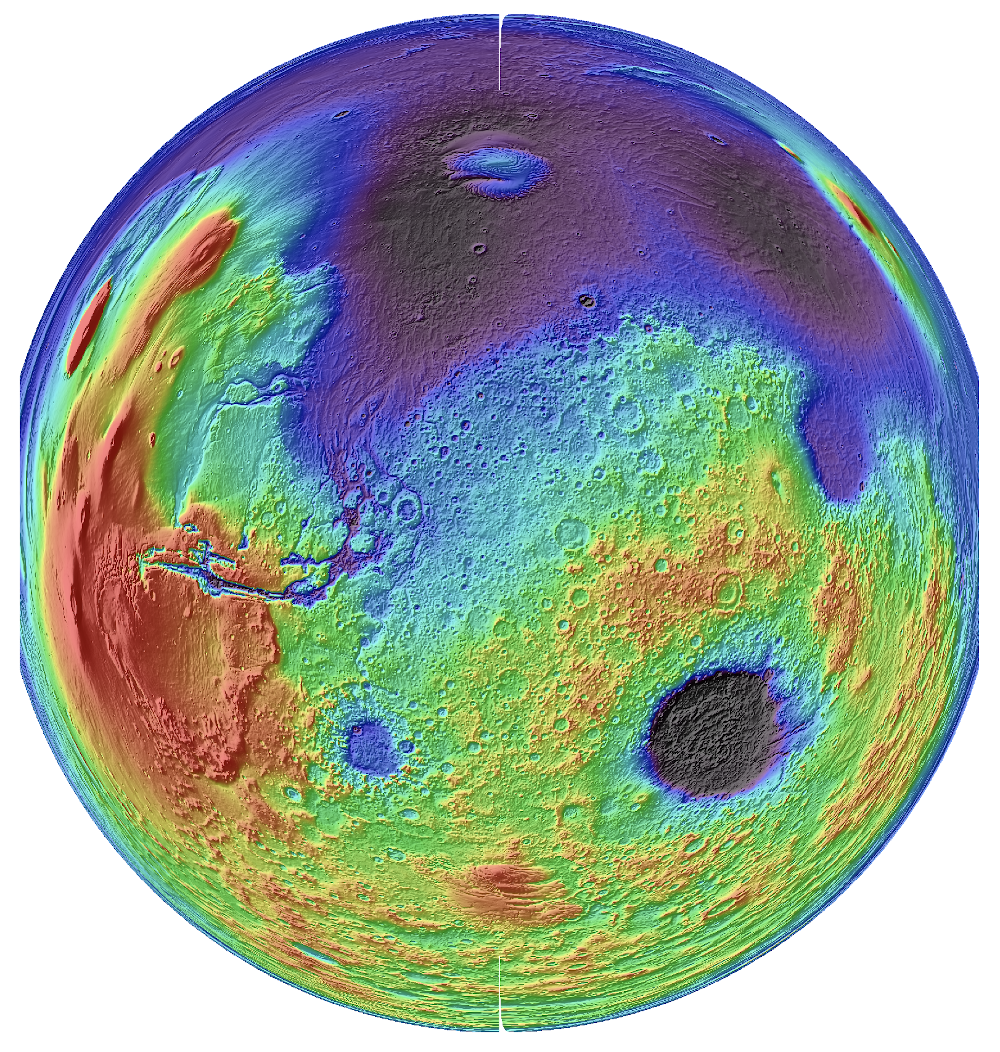
Lambert Azimuthal projection
Near-Sided projection (lon0 = -75)
Oblated Equal Area projection
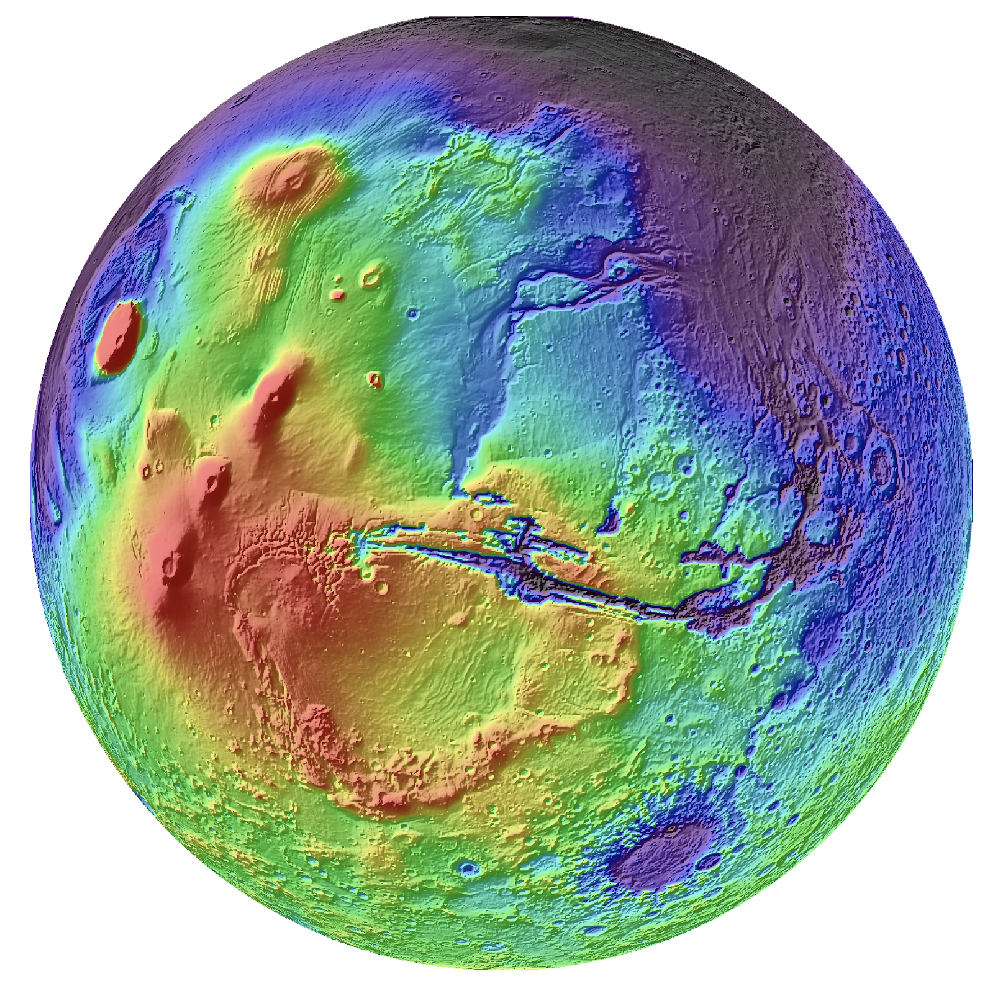
Orthographic projection
Polyconic projection
Van der Grinten I projection